Carter Bakkum, Senior Data Analyst, Healthcare Insights
Carter is a senior data analyst who works to turn complex, messy data into actionable intelligence. Carter studied economics and statistics at the University of Virginia before joining an economic consulting firm, where he supported expert testifying economic witnesses on behalf of fortune 500 healthcare companies. After the significant changes in the importance of data analytics during the pandemic, Carter joined the Trella team to dive deeper into the numbers to uncover the stories that drive our experience.![]()
Blog
2020’s Hospice Market Share Growth Leaders by State
By Carter Bakkum | April 23, 2021
For post-acute care (PAC) organizations, market share growth is a fairly good measurement of success. This post marks the first in a series of blogs that will explore how market share has changed over the most recent reported quarter as well as which companies grew the most in each state. Outlined below are the top three hospice market share growth leaders, by state.
Before we dive into the results, a quick word about overall trends. As we covered in our 2020 Industry Trend Report, 2020 was a year of incredible instability for post-acute care organizations. While, overall, hospice utilization remained fairly stable, there was a noticeable dip in admissions early in the year. So, which hospice organizations were able to rebound from this initial hit? And who came out on top as market share growth leaders?
Q3 2020 Hospice Market Share Growth Leaders
In an otherwise tumultuous year, we noticed one clear trend as we investigated the data: Q3 2020 was a quarter of recovery for hospice organizations. Many of the strongest market share growth leaders were the agencies who were able to recover their admissions to pre-pandemic levels during this period. Between Q1 and Q2 of 2020, nearly every hospice saw a dip in patient admissions. Q3, however, marked the beginning of a return to normalcy and a slow, but steady increase in patients for many hospice agencies. Many of the top market share growth leaders across the country were able to bounce back to pre-pandemic numbers.
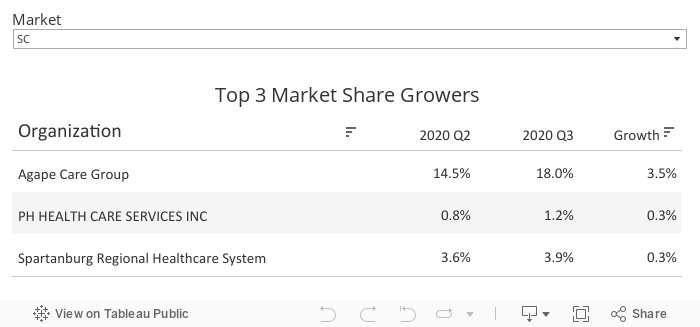
Below is an interactive tool that shows the top three market share growth leaders per state from Q2-Q3 2020. Select the state you would like to investigate to learn more:
Notable Growth Leaders – Nationally
Larger organizations were able to increase market share in more locations across the board. The following organizations most frequently ranked in the top five of market share growth leaders, nationwide.
| Organization | Number of Top 3 Ranks | States |
|---|---|---|
| Amedisys Inc | 6 | LA, ME, NJ, PA, RI, SD |
| ProMedica Health System | 6 | GA, IN, MI, MO, OK, WI |
| Compassus | 3 | AL, ME, OK |
| St Croix Hospice | 3 | IA, WI, MN |
Also notable, four of the five most frequent market share growth leaders are Trella Health customers.
Notable Growth Leaders – By State
North Dakota, Wyoming, Hawaii, and Massachusetts all saw the largest change in market share quarter-over-quarter, nationwide. Hospice of the Red River Valley in North Dakota saw the largest state-wide growth in market share, by far, at 5.1%.
States with higher competition and population, like California and Texas, tended to stay on the lower end of overall market growth. Four Seasons Hospice in Texas and Companion Hospice Home Health in California only saw a 0.1% increase in market share quarter-over-quarter. For California, all top five market share growth leaders increased by less than 0.3%. For Texas, all five were under 0.4%.
Next Steps
Market share growth has been and will continue to be an important success metric for post-acute care organizations to measure. Our upcoming posts in this series will focus on Home Health and Skilled Nursing market share growth leaders.
Marketscape from Trella Health gives hospice organizations visibility into trends in their markets to help them make strategic organizational decisions and the tools they need to grow market share. To learn more about Trella Health’s data or how to use our solutions to track your market share, analyze top market share changes in your markets, the competitive landscape, or identify potential acquisition targets, request a demonstration.
Our Methodology
As the leader in post-acute care analytics, Trella Health has unique insights into how an industry is performing as well as the individual companies within it. To get a comprehensive understanding of which hospice organizations managed to increase market share the most in 2020, we leveraged our data, which is comprised of 100% of Part A and B Medicare claims, to identify the National Provider Identifiers (NPIs) that showed the largest percentage growth between Q2 2020 and Q3 2020. We then aggregated the NPIs that rolled up to the same parent companies in each state. The market share per quarter is defined as the sum of market share in a state for each NPI associated with an owning company. For example, if a large company in California owns five individual NPIs – three that increased market share and two that lost market share, their market share percentages are aggregated to give a clear understanding of how that company performed as a whole, in that state. This allows us to see the top-performing companies in each state overall, not just the top-performing NPIs. Have questions about how we pull our data? Reach out to info@trellahealth.com!
About the Author:
