Carter Bakkum, Senior Consultant, Data & Analytics
Carter is a Senior Consultant of Data & Analytics who works to turn complex, messy data into actionable intelligence. Carter studied economics and statistics at the University of Virginia before joining an economic consulting firm, where he supported expert testifying economic witnesses on behalf of fortune 500 healthcare companies. After the significant changes in the importance of data analytics during the pandemic, Carter joined the Trella team to dive deeper into the numbers to uncover the stories that drive our experience.![]()
Blog
Exploring COVID-19’s Impact on Skilled Nursing Admission Trends
By Carter Bakkum | July 8, 2021
There’s no question that the COVID-19 pandemic impacted skilled nursing facilities (SNFs) everywhere. Quarantines and social distancing restrictions impacted admissions beginning in late Q1 2020, and suspensions of elective acute procedures did further damage to post-acute admissions across the industry. By digging deeper into the data surrounding admission rates and trends over previous years, we can better identify the overall industry impact of the pandemic – and where opportunities may lie for 2021 and beyond.
How has the COVID-19 pandemic impacted seasonal trends in skilled nursing admissions?
We can gain a lot of value from recognizing and understanding seasonal trends in the post-acute care industry. By comparing typical seasonal trends in skilled nursing admissions between 2017 and 2019 to 2020, we can get a better idea of the impact that COVID-19 has had on skilled nursing admissions.
In general, Q1 tends to have the highest skilled nursing admissions of the year. This well-documented trend is also reflected in other post-acute care settings and is especially prevalent in hospice admissions. When we look at admissions for Q1 2020 compared with Q1 2017, we might assume that COVID-19 had a significant impact on SNF admissions, but the graph below tells a different story. From 2017 to 2020, we can see a consistent decline over a four-year period. Even accounting for Q1 peaks each year, the trend is consistently down, illustrated by the opaque trendline for the given period
National Skilled Nursing Admissions by Quarter (2017 – 2020)
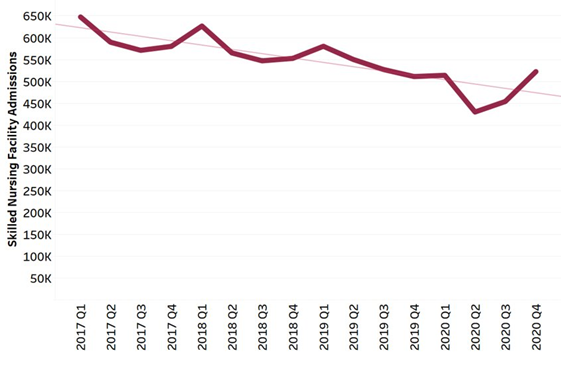
We can see from the graph that Q1 2020 was no different from previous years, demonstrating a slight uptick from Q4 admissions, although slightly smaller than in previous years. It’s notable, though, that this peak was well below Q1 admission levels in 2019.
Q2, however, was especially devastating to skilled nursing facilities, with a 16.3% quarter-over-quarter decline in SNF admissions. Even accounting for a typical dip from Q1 to Q2, that decline is drastic. We can also see another departure from the norm in Q4 2020, which saw higher SNF admissions than Q1 – a phenomenon that did not occur at all over the previous four years.
Part of the increase in SNF admissions here can likely be attributed to the increase in inpatient discharges as states and institutions removed suspensions on elective procedures in Q4. Suspending those elective procedures throughout the pandemic essentially created a backlog of pent-up demand for inpatient and skilled nursing services, as those therapies were likely postponed from their previously scheduled dates in Q2 or Q3 to new procedure dates in Q4 2020 or later. Likewise, Q4 2020 saw easements in the quarantine requirements laid on SNFs during the initial impact of the pandemic in Q2 and Q3. Relaxing these regulations could easily have led to additional admissions, as well.
Changing diagnostic mixes could present opportunities for SNFs
While looking at overall admission numbers can be helpful, we can get even more value by diving deeper into diagnostic mixes and how the pandemic impacted them. In the graph below, you’ll see the changes in major diagnostic categories as a percentage of total SNF admissions from Q4 2018 through Q4 2020 on a rolling 12-month average. Thus, percentages for Q4 2018, Q4 2019, and Q4 2020 represent the percent of total SNF admissions for each calendar year, not for each quarter. It’s also worth noting that, for our purposes in this article, we’ve taken only the top diagnostic categories.
Skilled Nursing Admissions by Diagnostic Category (2018 – 2020)
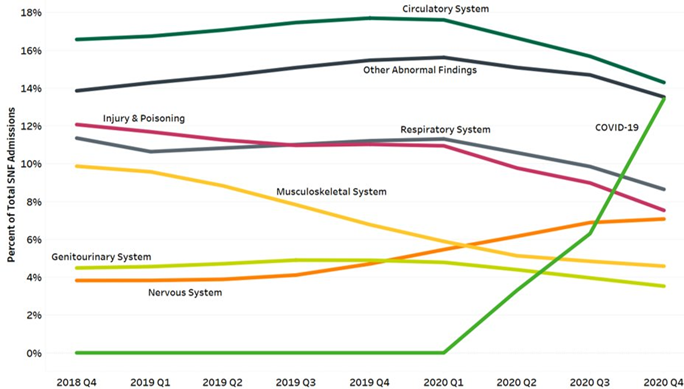
As expected, SNFs took on a significant number of COVID-19 patients, starting in Q2 2020 and increasing through Q4 2020. Looking at the full year, COVID-19 cases represented 13% of all SNF admissions for 2020. This is an important note, considering COVID-19 diagnoses almost certainly cannibalized some other diagnostic categories. We can see this, for example, in the decline of circulatory and respiratory system diseases, as those symptoms likely indicated severe cases of COVID-19.
However, COVID-19 cannot be blamed for all dips in admissions. As the graph shows, some diagnostic categories showed declining trends even before COVID-19 became a major diagnostic category. Injury and poisoning, as well as musculoskeletal patients all, declined as a percentage of total SNF admissions throughout the entire time period. Interestingly, though, admissions for nervous system diagnoses have continued to rise. The specific causes of these downward trends aren’t certain but could be due to factors such as increased preference for home health care or noncompliance with post-acute care recommendations. If you have any ideas or insights into why you think these admissions are down or if you have observations of your own SNF patient diagnosis mix to share, please don’t hesitate to reach out to us at [email protected] to share your experience.
Next Steps
As we look at these graphs and the trends they represent, we can see what we already know – that SNFs have been hit hard due to suspension of many inpatient procedures during the pandemic. However, this data also suggests that there are opportunities for SNFs to rebound as restrictions continue to be lifted and providers perform more elective procedures again. The major increase we saw in Q4 2020 SNF admissions showed that there wasn’t a lack of demand during the pandemic – but that demand was pent up due to restrictions. Further, there may be more opportunities for skilled nursing specialization in nervous system patients, as they seem to increasingly prefer skilled nursing care.
It’s important to note, though, that many patients still don’t receive post-acute care, even when recommended. Over 75% of inpatient discharges don’t receive any type of post-acute care within two days of discharge. Particularly concerning, 62.3% of high-acuity patients are discharged home and don’t enter any post-acute care setting within two days. Unsurprisingly, many of these patients are readmitted, driving up care cost while care quality suffers. These patients represent an opportunity to deliver quality care to those most in need by focusing on delivering the right care in the right setting.
Trella Health is the leader in market intelligence for the 65+ population, with extensive data sets including Medicare FFS, Medicare Advantage, commercial payers, ACOs, and DCEs. To learn more about how data insights and analytics for key metrics can help your organization control costs, improve patient outcomes, and build a stronger referral network, schedule a demo today.
About the Author:
