Carter Bakkum, Senior Data Analyst, Healthcare Insights
Carter is a senior data analyst who works to turn complex, messy data into actionable intelligence. Carter studied economics and statistics at the University of Virginia before joining an economic consulting firm, where he supported expert testifying economic witnesses on behalf of fortune 500 healthcare companies. After the significant changes in the importance of data analytics during the pandemic, Carter joined the Trella team to dive deeper into the numbers to uncover the stories that drive our experience.Key Quality Metrics for Successful SNF ACO Participation in 2021
By Carter Bakkum | August 9, 2021
As the Center for Medicare and Medicaid Services (CMS) continues to emphasize the transition to value-based care from fee-for-service models, Accountable Care Organizations (ACOs) have spent the last few years strategically choosing which physicians and facilities they should affiliate with. The healthcare industry is in transition and it’s important to understand how your skilled nursing facility (SNF) compares to those that are affiliated with ACOs. Using access to 100% of Medicare Part A and Part B claims, Trella investigated quality metrics for SNFs affiliated with an ACO to identify how these metrics compare to SNFs not affiliated with an ACO.
In our analysis, we found that ACO-affiliated SNFs tend to have lower-than-average patient hospitalization, rates, readmission rates, and average length of stay (ALOS). This was expected, as ACOs must choose SNF affiliates with outstanding performance in key metrics to succeed under risk-sharing programs like the Medicare Shared Savings Program (SSP). However, we also found that many SNFs not affiliated with an ACO outperform the average metrics for ACO-affiliated SNFs.
Understanding how your SNF’s quality metrics compare to ACO-affiliated SNFs can help you gain the insights you need to determine if your facility is qualified to start a conversation with an ACO, or to identify areas for improvement before approaching an ACO.
ACOs and the Transition to Value-Based Care
Under the Biden administration, CMS has continued to promote value-based care. This promotion has been pushed forward by groups of physicians, hospitals, post-acute care (PAC) agencies, and other healthcare providers, known as ACOs, who coordinate care across their Medicare patients.
SNFs are a vital component of ACOs. With the right SNFs in their networks, ACOs can improve care coordination, ensure that patients are sent to the best care settings to reduce hospitalizations and readmissions, and lower the overall cost of care for patients. Likewise, ACO affiliation is beneficial to SNFs, as the right affiliation can lead to more of the right referrals, as well as sharing in the financial incentives of a value-based payment model.
Because ACOs succeed by improving patient outcomes and lowering overall cost of care, they typically identify SNFs with outstanding performance in key metrics, including:
- ALOS
- Hospitalization rates
- Readmission rates
Because ACOs participate in shared savings as well as shared risk, the smart move is to target providers that measure the highest on these key quality metrics.
Insights into where the bar has been set for these quality metrics for ACO-affiliated SNFs can help ACOs determine which SNFs may be important additions to their organization. These insights can also help SNFs identify opportunities for improvement as they think seriously about affiliating with an ACO.
For this article, we pulled three graphs from Trella’s analysis of SNF ACO participation and quality metrics. These graphs compare the quality metrics at ACO-affiliated SNFs and SNFs in similar geographies that aren’t affiliated with an ACO. For each, you’ll see ACO-affiliated SNF metrics in red and non-affiliate SNF metrics in green. Let’s take a look at how ACO-affiliated SNFs are cherry-picked based on their quality metrics and benchmark quality metrics SNFs need in order to pursue ACO affiliation.
Methodology
Using CMS’ list of ACO participants, The Trella team identified SNFs affiliated with ACOS that were active between 2017 and 2019. We then used Trella’s access to 100% of Medicare Part A and Part B claims to calculate the quality metrics for these SNFs in 2019. We chose 2019 data to ensure that analysis was based on finalized facility participation according to CMS and to eliminate variables introduced by the impact of COVID-19 on quality metrics.
For our purpose, the comparative population in the graphs you’ll find below represents the list of SNFs that were not affiliated with an ACO between 2017 and 2019 and were in the same county as any SNF that appeared in the ACO-affiliated population. We chose SNFs based in the same counties to adjust for geographic variations in quality metrics and to ensure that the populations were more comparable to ACO-affiliated SNFs. For our investigation, we analyzed data from 308ACO-affiliated SNFs and 1,936 unaffiliated SNFs. Finally, each of the graphs in this article has been constructed based on NPI counts of SNFs bucketed into bins based on overall distribution.
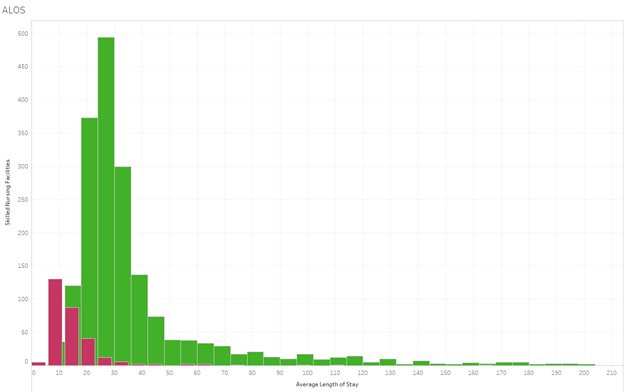
Average Length of Stay (ALOS): Significantly Lower for ACO Affiliates

The disparity between ALOS in 2019 for ACO-affiliated SNFs and non-ACO-affiliated SNFs is striking but not unexpected. Because ACOs share a financial risk based on patient outcomes and costs, they have likely chosen their SNF affiliates based on those with the highest quality metrics. You’ll notice that there are numerous ACO-affiliated SNFs with ALOS below 10, while many unaffiliated SNFs reported ALOS of 25-35. Because ALOS can have a massive impact on cost, SNFs that want to succeed in the transition to value-based payment models (either through ACOs or other models) should track this metric, analyze where they stand against key benchmarks, and determine how they can decrease ALOS to stand out against competitors.
Hospitalization: Lower Hospitalization Rates Correlate with Higher ACO Affiliation Percentages

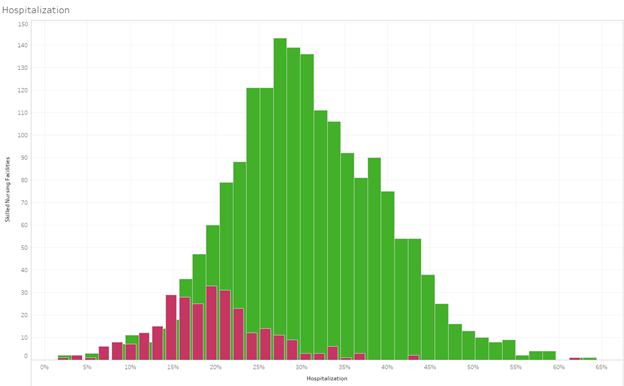
Hospitalization rates are another quality metric that can impact ACOs’ bottom lines. In this histogram, you can see the two-year hospitalization rates for SNFs – with red for ACO-affiliated SNFs and green for unaffiliated SNFs. The bell curves illustrate ACOs’ preference for SNFs with hospitalization rates lower than the average — as the peak of the ACO-affiliated SNFs’ bell curve is around 21%, while the peak for SNFs not affiliated with an ACO hovers around 30%.
Of note, when we look closer at these findings, we can see that there is a correlation between lower hospitalization rates and higher percentages of ACO-affiliated SNFs. And, while there are fewer ACO-affiliated SNFs with hospitalization rates above 30%, the highest hospitalization rate for this population is up to 61%, indicating niche opportunities for SNFs, even with higher-than-average hospitalization rates.
Readmissions: ACOs Select SNFs with Lower-than-Average Readmission Rates

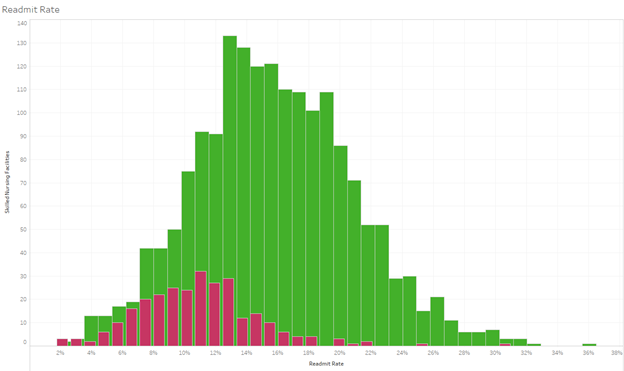
Our findings for readmission rates from 2017 to 2019 are very similar to our observations around hospitalization rates. The average readmission rate for ACO-affiliated SNFs, peaking at 13%, is clearly lower than the overall average for SNFs not affiliated with an ACO, which came in at 15-16%. However, the absolute difference isn’t nearly as wide as hospitalization. Again, the ratio of ACO-affiliated SNFs to non-ACO-affiliated SNFs increases drastically as you move towards the lower end of the bell curves, indicating a significant preference of ACOs for SNFs with the absolute best quality metrics in a certain geography.
Next steps: Tracking Quality Metrics for Success in 2022 and Beyond
ACOs are gaining momentum in the shift to value-based care, and SNF leaders should take note. If your facility is a potential candidate for ACO affiliation, you can benefit from access to key quality metrics – such as ALOS, hospitalization, and readmissions – for your SNF and competing SNFs in your area. With this data, you can identify areas where you excel and stand out from the competition, as well as areas for improvement before considering ACO affiliation.
Trella Health is the leader in market intelligence for the 65+ population, with extensive data sets including Medicare FFS, Medicare Advantage, commercial payers, ACOs, and DCEs. To uncover potential growth opportunities in your market and learn more about how data insights and analytics for key metrics can help you control costs, improve patient outcomes, and build a stronger referral network, schedule a demo today.


