Carter Bakkum, Senior Consultant, Data & Analytics
Carter is a Senior Consultant of Data & Analytics who works to turn complex, messy data into actionable intelligence. Carter studied economics and statistics at the University of Virginia before joining an economic consulting firm, where he supported expert testifying economic witnesses on behalf of fortune 500 healthcare companies. After the significant changes in the importance of data analytics during the pandemic, Carter joined the Trella team to dive deeper into the numbers to uncover the stories that drive our experience.![]()
Blog
Post-Acute Care Episodes and Adherence After Inpatient Stay by Diagnostic Category
By Carter Bakkum | May 6, 2022
Home health episodes and adherence after inpatient stay by diagnostic category
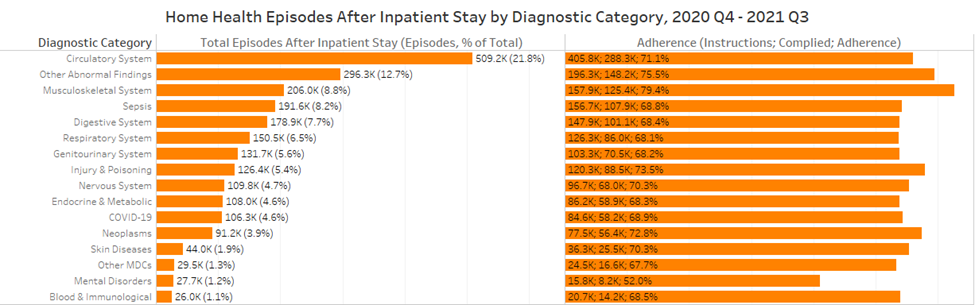
The above chart illustrates the total number of home health episodes within 30 days of inpatient discharge, regardless of instruction, and the adherence rate, which includes the number of inpatient discharge episodes instructed to enter home health as well as the number of those episodes that complied. Unsurprisingly, cardiac patients make up the plurality of home health episodes with 1 in 5 episodes after inpatient discharge. Adherence for circulatory patients, at 71.1%, is slightly lower than the overall average for home health, 71.9%, and indicates 117.5K circulatory episodes discharged with home health instructions did not adhere. While the 220.9K circulatory episodes that entered home health care after inpatient discharge without home health instructions almost doubles the episodes for non-adhering patients, it’s essential for home health agencies to ensure a smooth transition from inpatient stays to home health admission.
The largest outlier for adherence, which we also see for skilled nursing, is for episodes with a primary diagnosis of a mental disorder. Reports of severe loneliness, which deleteriously impacts mental health, increased from 6% to 21% during the COVID-19 pandemic and, alarmingly, almost half of inpatient stays with a mental disorder diagnosis do not adhere to home health discharge instructions. While episodes with a primary diagnosis of mental disorders make up only 1.2% of overall episodes after inpatient stay, the abysmal adherence to instructions amid increased prevalence and severity of mental health issues during the pandemic indicates the need for home health agencies to enter and expand in psychotherapies.
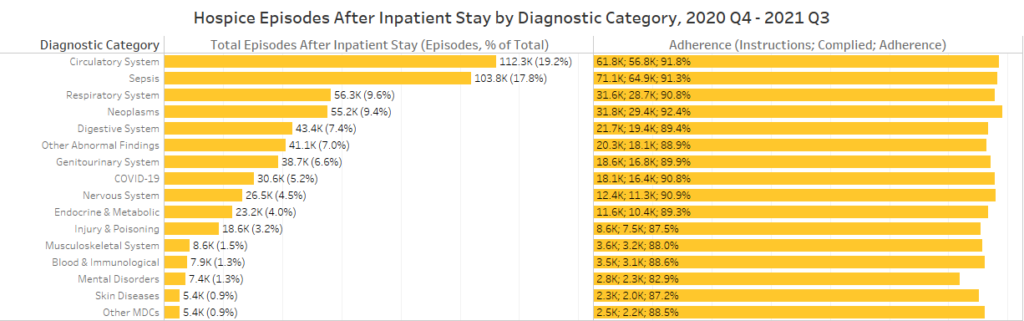
Hospice episodes and adherence after inpatient stay by diagnostic category
In the future, CMS likely will (and should) revise the 10 criteria that drive the HCI to be more stringent. Higher thresholds for criteria will offer a much more valuable index and provide hospice agencies a consolidated, easy-to-understand metric to differentiate themselves against their local competitors. For instance, in Cook County, Illinois, let’s say hospice agency A has an HCI score of 10 with 300 patient admissions in the last four quarters. Hospice agency B has an HCI score of 8 with 500 patient admissions. Agency A should be able to quickly go to agency B’s referral sources and illustrate a significant gap in coverage provided by agency B, simply by showing their comparative HCI scores.
Skilled nursing episodes and adherence after inpatient stay by diagnostic category
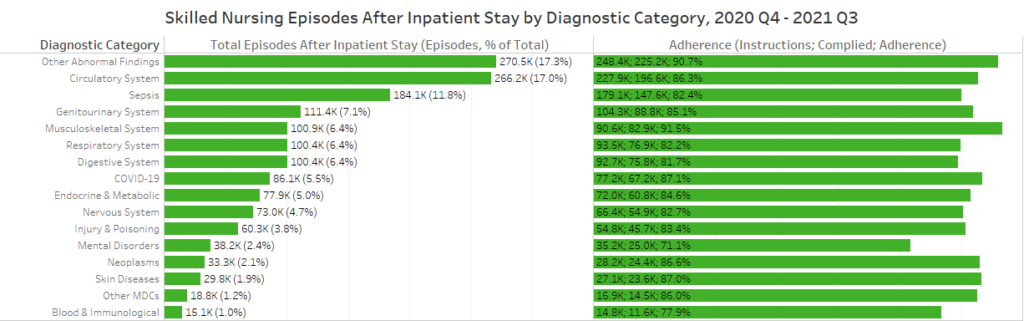
The above chart illustrates the total number of skilled nursing episodes within 30 days of inpatient discharge, regardless of instruction, and the adherence rate, which includes the number of inpatient discharge episodes instructed to enter skilled nursing care as well as the number of those episodes that complied. Other abnormal findings (17.3%), circulatory system (17.0%), and sepsis (11.8%) episodes make up almost half of skilled nursing episodes after inpatient stay (46.1%), though sepsis episodes’ adherence rate (82.4%) is over three percentage points below the national average (85.5%).
As with home health, the lowest adherence rate is for episodes with a primary diagnosis under the mental disorder category. Again, the low adherence rate and increased prevalence of mental health issues during the pandemic point to the need for skilled nursing providers to address these issues, regardless of the primary diagnosis.
Further investigations into post-acute care trends
This blog leveraged much of its information from Trella’s Industry Trend Report. For more insights on trends in the post-acute industry and how you can use data to drive strategic decision-making, download the full Industry Trend Report here. For more analyses into Medicare data and how data illustrates the importance of post-acute care and how to take advantage of changing healthcare, all my analyses are saved on my author page, linked here.
About the Author:
