![]()
At Trella Health, our goal is to provide the latest market intelligence in our analytics solutions while increasing awareness of the importance of post-acute care. We are excited to share the most recent post-acute care trends, derived from our analysis of Q2 2019 through Q1 2020 Medicare Fee-for-Service claims data. Below you will find key insights into metrics such as inpatient discharge instructions, admissions, and utilization for home health, hospice, and skilled nursing.
Highlights:
- PAC Discharges and Instructions
- Skilled nursing facilities and home health continue to be the most common destinations
- General shifts in the industry suggest the cost and benefit of providing care at a SNF vs. at home will favor home health
- To date, PDGM’s introduction has not appeared to impact the number of inpatient discharges referred to home health
- COVID-19 is expected to further increase inpatient discharge instructions to home health
- Skilled Nursing
- Utilization and admissions continue to trend downward
- Skilled nursing is expected to be utilized less and less, and the care setting will likely favor providing highly specialized care to higher acuity patients
- Hospice Length of Stay
- Longer length of stay is likely due to increasing awareness about the benefits of hospice care and an industry focus on referring eligible patients to hospice sooner
- Home Health Adherence
- Overall adherence rates have improved
- COVID-19 poses risks to the future of home health and should continue to be monitored
Post-Acute Discharge Instructions and Destinations
National Medicare post-acute care (PAC) discharge instructions did not fluctuate much from what we reported in Q1 2019. For the Q2 2019 to Q1 2020 reporting period, 50.6% of inpatient discharges were coded for PAC. This represents a slight decrease from the 52.2% of discharges referred for PAC during the previous four quarters.
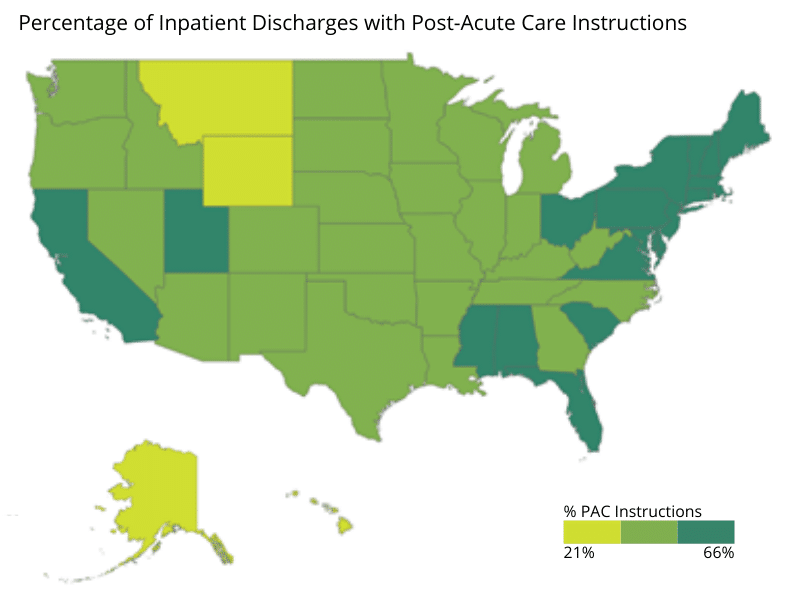
Discharge instructions varied regionally, with northeastern and mid-Atlantic states more likely to refer patients for post-acute services than midwestern and western states. Four states with PAC referral rates of 60% or higher are all clustered in the northeast. Connecticut coded the highest percentage of discharges for PAC at 66%, followed by Massachusetts at 62%, then Rhode Island, and New Hampshire with referral rates of 60%.
At the other end of the spectrum, Alaska coded the lowest percentage of discharges for PAC, at just 21%. Montana, Wyoming, Hawaii, and Oregon rounded out the bottom five states for PAC referrals at 32%, 33%, 36%, and 36%, respectively. These regional differences are in line with the trends Trella has seen in prior years. It is important to note these percentages are based on total episodes discharged rather than unique patient counts, meaning they include patients who had multiple inpatient stays during the reporting period.
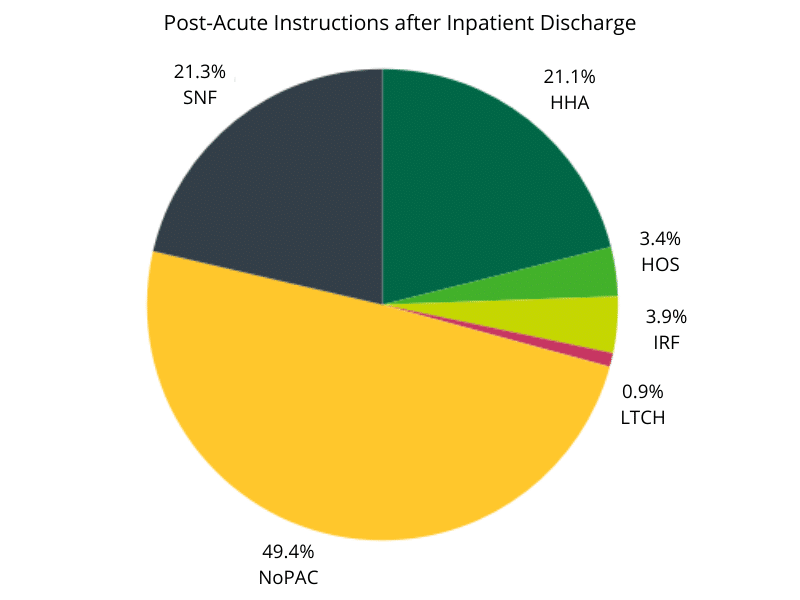
For patients who received PAC instructions upon discharge during the reporting period, skilled nursing was the most likely referral destination at 21.3%, only slightly edging out the 21.1% coded for home health. After home health, an Inpatient Rehab Facility (IRF) was the most common PAC referral destination at 3.9%, followed by hospice at 3.4%. In the previous reporting period hospice was slightly ahead of IRF, with 3.7% and 3.1% of discharges coded for the care settings, respectively. Referrals to Long-term Care Hospitals (LTCH) remained essentially flat, comprising .9% of inpatient discharge instructions vs. 1% in the previous reporting period.
In Trella’s Q1 2019 Industry Trend Report, home health was instructed at a higher rate than SNF for the first time since we began tracking post-acute destinations. During that time frame, 23.3% of episodes were discharged with home health instructions compared to 21.1% referred to SNF.
The reversal back to SNF as a more common PAC referral destination than home health is not something we expect to continue in future quarters, especially considering the impact COVID-19 has had on SNF occupancy. As a result of the pandemic, we anticipate a sharp drop off in the percentage of SNF referrals for Q2 2020. While there is a potential for the share of home health referrals to increase due to SNF diversion, another possibility is a decrease in overall PAC discharge instructions because of concerns around care providers entering patients’ homes.
Skilled Nursing Admissions and Utilization
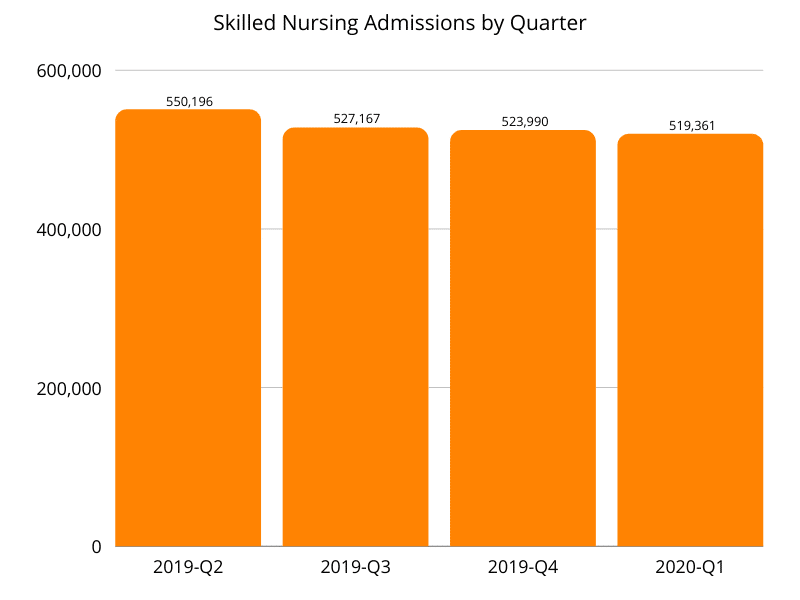
Although a larger share of inpatient episodes were referred to SNF during this reporting period than the previous one, both SNF admissions and utilization continued to decline. Admissions fell from 571,177 in Q1 2019 to 519,361 in Q1 2020, representing a 9% year over year decrease. Interestingly, the decrease in SNF admissions from Q1 2018 to Q1 2019 was also 9%.
From a SNF utilization perspective, the nationwide rate was 20% for the Q1 2020 reporting period, compared to 25.1% during the Q1 2019 reporting period. This drop represents a 20.3% falloff year over year. Given what we know about the devastating effects COVID-19 has had on SNFs, the fact utilization declined so precipitously ahead of Q1 2020 is a major concern for the sector.
Hospice Average Length of Stay
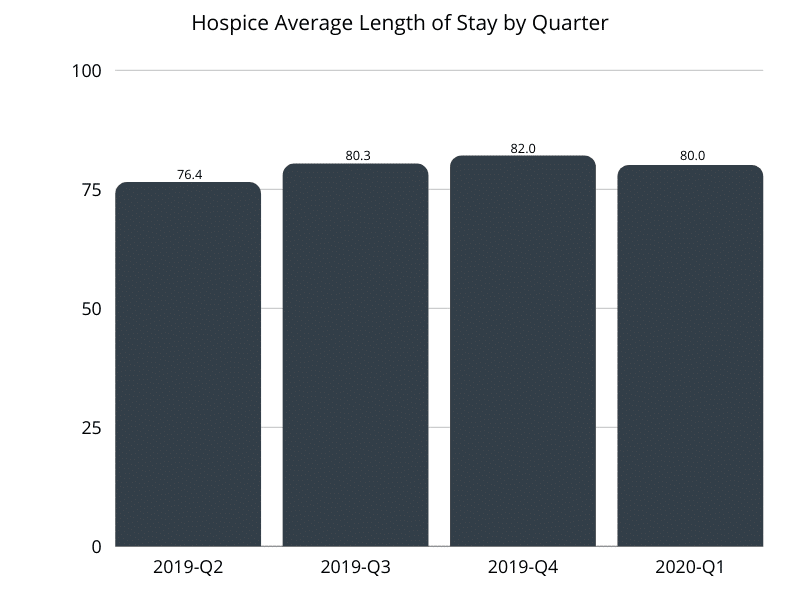
For the four quarters ending in Q1 2020, hospice ALOS was 79.7 days compared to 77.9 days for the previous reporting period. The extra 1.8 days represents a 2.3% increase year over year and a 7% increase from the 74.5 days in the Q1 2018 reporting period. Although a more modest spike than the 5% jump we saw in last year’s report, a longer ALOS two years in a row could represent greater physician and patient awareness regarding hospice eligibility and benefits of the care setting.
As Trella has observed previously, ALOS varied significantly by market. While the nationwide average for Q1 2020 was 80 days, ALOS ranged from 36.7 days in Wyoming to 103.9 in Utah. Alabama had the second-highest ALOS at 100 days, followed by New Mexico at 99.9, Oklahoma at 97, and Georgia at 94.3 to round out the top five. Aside from Wyoming, five states had an ALOS below 57, with 51.5 days for South Dakota, 53.5 for New York, 54.4 for Kentucky, and 56.8 for both Alaska and Connecticut.
Home Health Adherence
Home health adherence improved slightly between Q3 2019 and Q1 2020, increasing from 70.3% to 71.7%. We are curious to see how COVID-19 affects adherence rates, as patients had to balance a desire to receive care at home, if possible, with the fear of caretakers potentially spreading the virus. Especially early in the pandemic, when personal protective equipment was scarce and testing was limited, patients were forced to make difficult decisions and tradeoffs. Should they forego necessary care to reduce their probability of exposure, especially given the heightened risk for severe illness based on age and existing health conditions?
Since Trella’s last trend report, we’ve changed how we calculate home health adherence. Previously adherence was based on the percentage of patients who received home health instructions following an inpatient stay and started a new home health episode within 30 days of discharge. Our updated adherence metric is calculated as the percentage of home health episodes started or resumed within 30 days of discharge as instructed, divided by the total number of discharges with home health instructions.
Conclusion
Our analysis of Medicare claims for the Q1 2020 reporting period uncovered some noteworthy data points, though post-acute care trends remained fairly stable. As the first quarter of COVID-19 impacted data becomes available, we anticipate greater shifts and disruptions to established patterns will emerge. In addition to our annual Industry Trend Report, we will be publishing a shorter Q2 2020 data highlights piece focused on COVID-19 effects, slated for early December 2020
