Carter Bakkum, Senior Consultant, Data & Analytics
Carter is a Senior Consultant of Data & Analytics who works to turn complex, messy data into actionable intelligence. Carter studied economics and statistics at the University of Virginia before joining an economic consulting firm, where he supported expert testifying economic witnesses on behalf of fortune 500 healthcare companies. After the significant changes in the importance of data analytics during the pandemic, Carter joined the Trella team to dive deeper into the numbers to uncover the stories that drive our experience.![]()
Blog
Q2 2020 Trends: Inpatient Average Length of Stay
By Carter Bakkum | December 21, 2020
The Trella Health team is excited to bring you more results from our market analysis of Medicare claims data for Q2 2020. We’ve previously analyzed and quantified some of the ways COVID-19 impacted patient discharge rates and SNF utilization and admissions. In this article, we explore some surprising findings related to hospital inpatient average length of stay (ALOS) compared with Q2 2019.
Highlights
- In Q2 2019, state-level inpatient ALOS typically falls between 5.8 and 6.4.
- Overall patient ALOS for Q2 2020 showed a slight increase, with most states ranging from 5.1 to 7.8.
- COVID-19 patients represented 5.2% of overall Q2 2020 patient stays.
- COVID-19 patient ALOS counts were significantly higher than overall patient ALOS counts for Q2 2020.
Q2 2019: A Baseline for ALOS
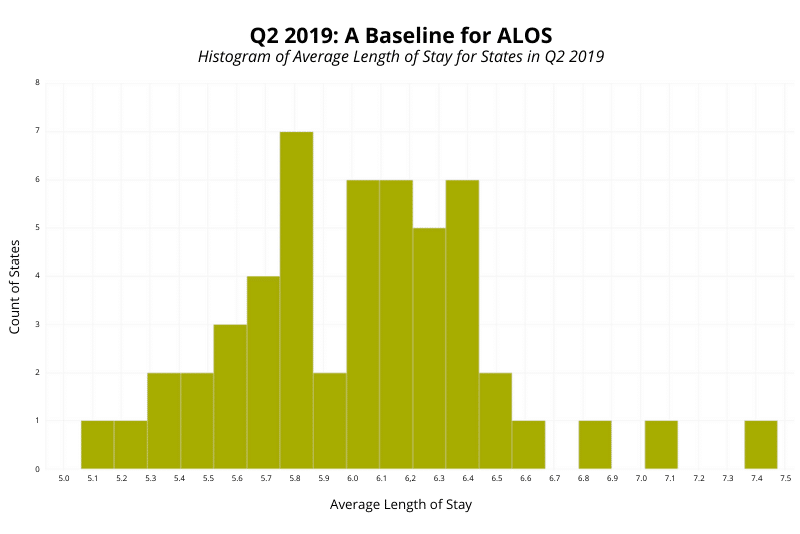
For a more meaningful Q2 2020 ALOS analysis, we first wanted to define a baseline for Q2 in a typical year. This histogram provides a count of states (and Washington, DC) with an inpatient ALOS across the entire state equal to the value across the bottom. This information provides the baseline we need to compare Q2 2020 values to determine whether there are any significant changes to ALOS attributable to the impact of COVID-19.
Comparing against Q2 2019 ALOS counts allows us to account for any fluctuations in seasonality to inpatient ALOS. From the Q2 2019 Medicare claims data, we can see that ALOS in a typical quarter ranges from 5.1 (WY) to 7.4 (DC) with the majority of states falling between 5.8 and 6.4. Since both the average and mean ALOS across all states is 6.03, we can infer that the distribution is close to normal and there aren’t any significant outliers or significant skews to one extreme or the other.
Overall ALOS for Q2 2020
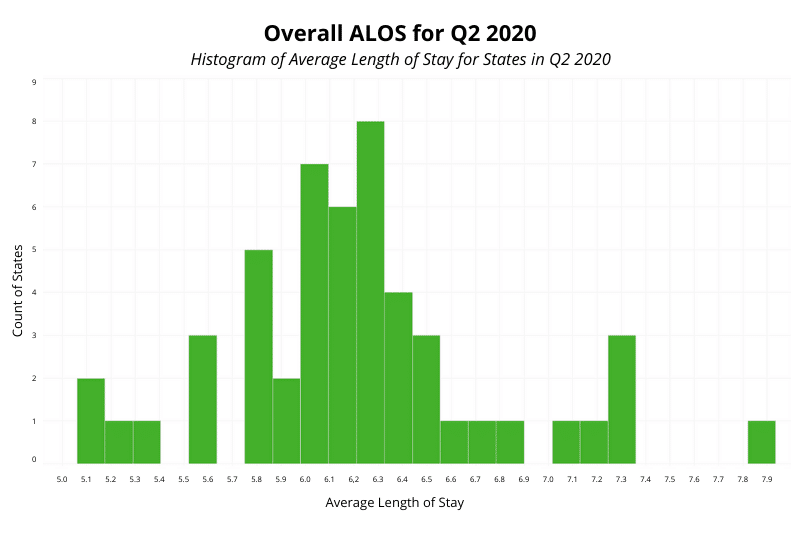
In this visualization, we see the same data as before, updated to reflect Q2 2020, with ALOS on the x-axis and states’ counts of ALOS on the y-axis, omitting ALOS data from June 2020*. From this data, we see that ALOS for all inpatients does not change significantly between 2019 and 2020. We see a slight uptick in length of stay, as the distribution moved slightly to the right of the graph.
For Q2 2020, the range for ALOS stayed relatively consistent with 2019’s numbers, ranging from 5.1 (ID) to 7.8 (DC). However, both median and average saw notable increases, with median increasing from 6.03 to 6.21 and average increasing from 6.03 to 6.15. Upon further analysis, we found that these changes were supported across nearly all states, rather than a few outliers with major increases. Of 51 states and DC, 39 showed increases in ALOS between Q2 2019 and Q2 2020.
Initially, these results are counterintuitive, as we would expect a decrease in ALOS with doctors attempting to move patients out of hospitals with COVID-19 patients to reduce exposure. However, further analyzing the available data can help provide a more complete view of COVID-19’s impact on ALOS.
Q2 2020 ALOS for COVID Patients
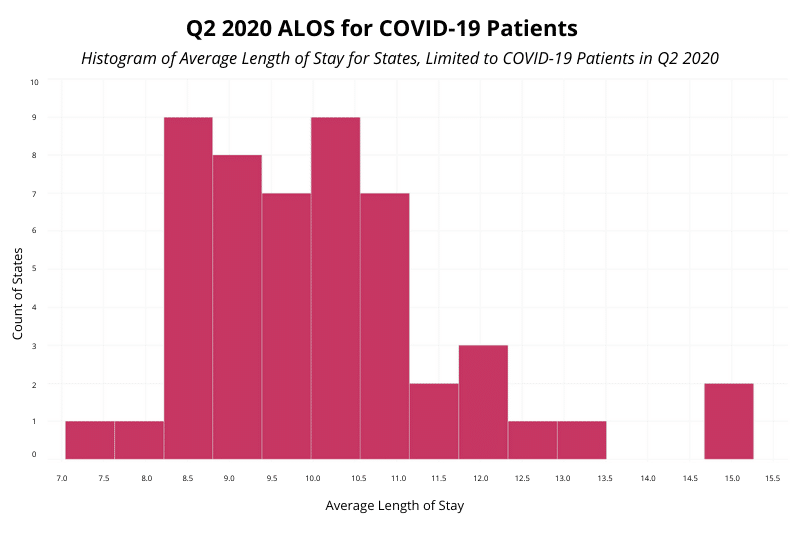
While COVID-19 patients only represent 5.2% of patient stays in Q2 2020, this histogram shows a significant increase in ALOS for COVID-19 patients over ALOS for all patients*. In each state, the ALOS for COVID-19 patients is higher than the state’s overall ALOS for 2020. Likewise, the average and median ALOS for COVID-19 patients in Q2 2020 across all states are much higher than the overall Q2 2020 counts, coming in at 9.66 and 9.17, respectively. Further, from this chart we can see the lowest CCOVID-19 patient ALOS is 7.04 (SD), which is just slightly below the highest overall ALOS at 7.8 (DC). The highest count for COVID-19 ALOS was 13.9 (FL), significantly higher than any of the overall patient counts.
Given this data, we can speculate about the potential causes of COVID-19 patients’ impact on Q2 2020 ALOS counts. Increases in length of stay may correlate with the time needed for doctors to try multiple therapies. In April and May of 2020, there was still relatively little guidance on how to treat COVID-19 patients. Likewise, the severity of the illness and the time necessary for the body to recover likely lengthened patients’ hospital stays. At the same time, hospitals were taking precautions to contain the disease, including keeping COVID-19 patients longer to prevent them from further spreading the virus. It’s important to note, though, that these are only conjectures based on the available ALOS data. We are not claiming that these are the definitive causes of increases in COVID-19 patient ALOS.
Conclusion
The Trella Health team’s analysis of ALOS trends for Q2 2019 and Q2 2020 revealed an unexpected upward trend in length of stay. However, once we looked further into the data, pulling out numbers specific to COVID-19 patients’ stays, we uncovered valuable information on the impact the coronavirus pandemic has had on hospital systems. While it was initially surprising that ALOS increased from 2019 to 2020, longer ALOS counts for COVID-19 patients likely helped offset shorter stays for other patients.
As the leader in provider performance insights and analytics, the Trella team continues to assess how COVID-19 and other factors impact the acute and post-acute care markets. Along with this blog series highlighting COVID-19’s effect on Q2 2020, look for Trella’s annual Industry Trend Report in January 2021 for analyses based on insights from the latest Medicare claims data available.
* ALOS for Q2 2019 is calculated based on counts from April, May, and June 2019. ALOS for Q2 2020 is calculated based on counts from April and May 2020.
About the Author:
