Carter Bakkum, Senior Consultant, Data & Analytics
Carter is a Senior Consultant of Data & Analytics who works to turn complex, messy data into actionable intelligence. Carter studied economics and statistics at the University of Virginia before joining an economic consulting firm, where he supported expert testifying economic witnesses on behalf of fortune 500 healthcare companies. After the significant changes in the importance of data analytics during the pandemic, Carter joined the Trella team to dive deeper into the numbers to uncover the stories that drive our experience.![]()
Blog
2020’s Skilled Nursing Market Share Growth Leaders
By Carter Bakkum | May 21, 2021
Our final post in our market share growth leader series is about skilled nursing facilities. Just like our previous posts on hospice and home health, we’ve narrowed down the skilled nursing facilities that increased their market share the most from Q2 to Q3 2020. As noted in our 2020 Industry Trend Report, skilled nursing admissions have steadily decreased over the past few years and were further impacted by COVID-19. So which organizations were able to maintain or even rebuild their census in order to be named one of our skilled nursing market share growth leaders?
Q3 2020 Skilled Nursing Market Share Growth Leaders
Skilled nursing facilities were hit particularly hard as many patients and physicians opted for home-based care rather than congregate care settings. Further complicating matters, SNFs have had to implement new protocols, like isolation periods and limited interaction, to protect their staff and other patients from potential COVID-19 exposure. This not only increased the length of stay for most patients, decreasing efficiency, but also impacted certain therapy exercises or treatments that providers could perform. Furthermore, increased regulation on personal protective equipment (PPE) put additional strain on an already taxed industry. Overall, SNFs had a lot of ground to make up following the initial quarter of the pandemic.
From our research, it appears that Q3 was a period of rebuilding for many SNFs, as it was for hospice organizations. The skilled nursing facilities that emerged as market share growth leaders faced an uphill battle. 2020 Q2 admission counts were lower year-over-year and quarter-over-quarter for almost all SNFs – but increases in 2020 Q3, even slight ones, indicates that the industry is recovering.
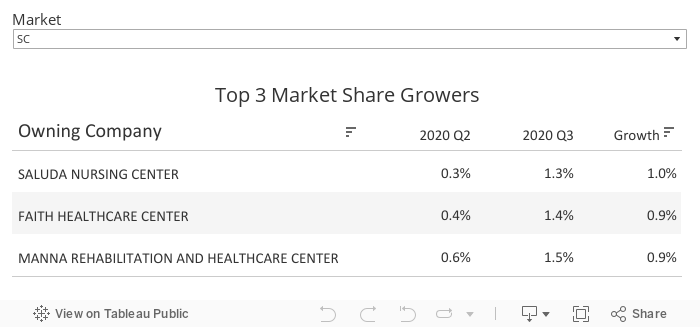
Below is an interactive tool that shows the top three market share growth leaders per state from Q2-Q3 2020. Select the state you would like to investigate to learn more:
Notable Growth Leaders – Nationally
Unlike our former posts for home health and hospice organizations, there was very little repetition in the top three rankings. In fact, only the four following organizations had top three rankings in more than three states, nationwide.
| Organization | Number of Top 3 Ranks | States |
|---|---|---|
| Genesis Healthcare | 10 | DE, MA, MD, ME, NM, NH, NJ, RI, VT, WV |
| Life Care Centers of America | 4 | AZ, FL, NE, WY |
| Sanford Health | 4 | IA, KS, MN, SD |
| Trilogy Health Services LLC | 4 | IN, KY, MI, OH |
Several other organizations, including Advanced Health Care, Ascension Health, and Delmar Gardens ranked in the top three for two distinct states. This could indicate that SNFs, large or small, were on relatively equal footing during this period.
Top Overall Market Share Growth – By Percentage
Of the 153 organizations that ranked in the top three of their states, only nine were able to grow by more than 3% quarter-over-quarter. Genesis Healthcare and Life Care Centers of America, two of the notable growth leading companies, claimed several spots on the highest overall market share growth. Genesis Healthcare, for example, had three locations in our top nine and claimed the top two spots with 5.4% growth in Delaware and 4.9% in New Mexico.
| Organization | State | Growth Percentage |
|---|---|---|
| Genesis HealthCare | DE | 5.4% |
| Genesis HealthCare | NM | 4.9% |
| Trilogy Health Services LLC | IN | 4.8% |
| Life Care Centers of America | WY | 4.3% |
| Cadia Healthcare | DE | 4.1% |
| Genesis HealthCare | NH | 3.8% |
| Advanced Health Care | NM | 3.8% |
| Benedictine Health System | ND | 3.2% |
| Providence St Joseph Health (AKA Providence) | AK | 3.2% |
Notable Growth Leaders – By State
As mentioned, because skilled nursing admissions were down in Q2 almost across the board, many of the organizations that ranked in the top three for their state actually saw a year-over-year decrease. Out of the 153 SNFs that ranked in their state’s top three market share growth leaders, 90 increased their admissions from 2020 Q1 levels, while 63 saw lower admissions than Q1 2020.
Five of the top skilled nursing market share growth leaders in Connecticut, Washington DC, and Massachusetts saw a decrease in admissions between Q2 and Q3. It’s likely that these states saw a slight increase in admissions in Q2, due to recommendations and regional regulations that encouraged congregate care settings for COVID-19 patients. These agencies were able to take a top-three slot in their respective states, however, because their Q3 admissions decreased at a slightly slower pace than others in their market.
Next Steps
Because market share is such a critical measurement of growth and overall success, skilled nursing facilities need to find ways to increase their referrals and adapt to a post-pandemic world. Leveraging performance metrics to identify and communicate the effectiveness of your organization will help create a path back towards normalcy.
Marketscape from Trella Health gives skilled nursing organizations visibility into trends in their markets to help them make strategic organizational decisions and the tools they need to grow market share. To learn more about Trella Health’s data or how your organization can use our solutions to track your market share, analyze top market share changes in your markets, the competitive landscape, or identify potential acquisition targets, request a demonstration.
Our Methodology
As the leader in post-acute care analytics, Trella Health has unique insights into how an industry is performing as well as the individual companies within it. To get a comprehensive understanding of which skilled nursing facilities managed to increase market share the most in 2020, we leveraged our data, which is comprised of 100% of Part A and B Medicare claims, to identify the National Provider Identifiers (NPIs) that showed the largest percentage growth between Q1 2020 and Q2 2020. We then aggregated the NPIs that rolled up to the same parent companies in each state. The market share per quarter is defined as the sum of market share in a state for each NPI associated with an owning company. For example, if a large company in California owns five individual NPIs – three that increased market share and two that lost market share, their market share percentages are aggregated to give a clear understanding of how that company performed as a whole, in that state. This allows us to see the top-performing companies in each state overall, not just the top-performing NPIs. Have questions about how we pull our data? Reach out to [email protected]!
About the Author:
