Carter Bakkum, Senior Data Analyst, Healthcare Insights
Carter is a senior data analyst who works to turn complex, messy data into actionable intelligence. Carter studied economics and statistics at the University of Virginia before joining an economic consulting firm, where he supported expert testifying economic witnesses on behalf of fortune 500 healthcare companies. After the significant changes in the importance of data analytics during the pandemic, Carter joined the Trella team to dive deeper into the numbers to uncover the stories that drive our experience.![]()
Blog
Hospice Quality Metrics from Claims Data
By Carter Bakkum | May 5, 2022
In its current state, the Hospice Care Index fails to adequately differentiate hospice agencies
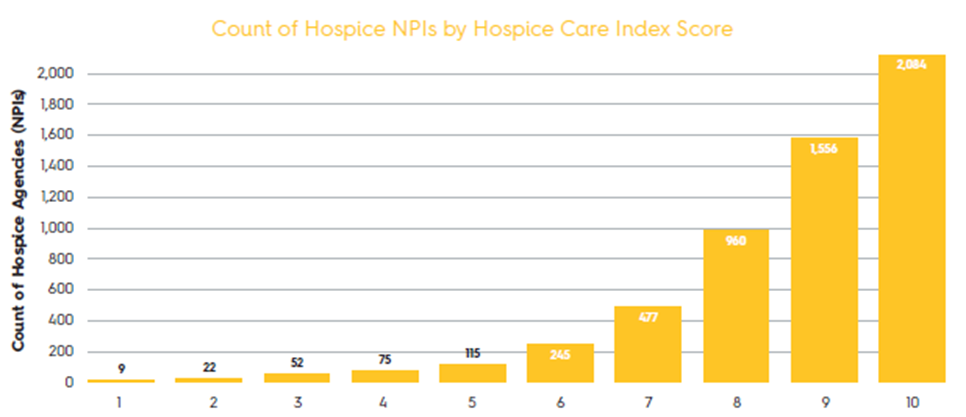
After input from the hospice agencies, the Hospice Quality Reporting Program (HQRP) released the HCI in early February 2022. The HCI is a composite of ten different hospice quality measures, including visits near death, skilled nursing minutes on weekends and during routine home care, early/late live discharges and burdensome transitions. Each measure has a threshold, and a hospice receives one point on the HCI for each threshold that it meets. As a result, each hospice will have a composite score of 0 (the hospice didn’t meet any of the threshold criteria) to 10 (the hospice met all threshold criteria).
In theory, the HCI should provide another tool in an agency’s tool kit to concisely illustrate the high quality of care provided by an individual hospice in comparison to other agencies in the same market. However, over one-third of hospice agencies have an HCI score of 10 and 82.2% of NPIs have an HCI score between 8 and 10. The conspicuous concentration of agencies in higher HCI scores indicates a failure in the criteria to adequately differentiate the quality between separate hospices. Little variation nationally proxies for the same pattern in smaller markets. For example, 20 out of the 21 hospices serving all of Wyoming have a score of 7 or above.
The future of the Hospice Care Index
In the future, CMS likely will (and should) revise the 10 criteria that drive the HCI to be more stringent. Higher thresholds for criteria will offer a much more valuable index and provide hospice agencies a consolidated, easy-to-understand metric to differentiate themselves against their local competitors. For instance, in Cook County, Illinois, let’s say hospice agency A has an HCI score of 10 with 300 patient admissions in the last four quarters. Hospice agency B has an HCI score of 8 with 500 patient admissions. Agency A should be able to quickly go to agency B’s referral sources and illustrate a significant gap in coverage provided by agency B, simply by showing their comparative HCI scores.
Further investigations into post-acute care trends
This blog leveraged much of its information from Trella’s Industry Trend Report. For more insights on trends in the post-acute industry and how you can use data to drive strategic decision-making, download the full Industry Trend Report here. For more analyses into Medicare data and how data illustrates the importance of post-acute care and how to take advantage of changing healthcare, all my analyses are saved on my author page, linked here.
About the Author:
