
UP TO DATE. TO THE POINT. ALWAYS INSIGHTFUL.
UP TO DATE. TO THE POINT. ALWAYS INSIGHTFUL.
Post-Acute Industry Trends Quarterly
Post-Acute Industry Trends Quarterly
![]()
Use these condensed trend reports and insights to quickly see the state of the post-acute industry. Feel free to to share this page, check back for quarterly updates, and use the charts in your own presentations.
(Click on each chart to enlarge)
")
Home Health
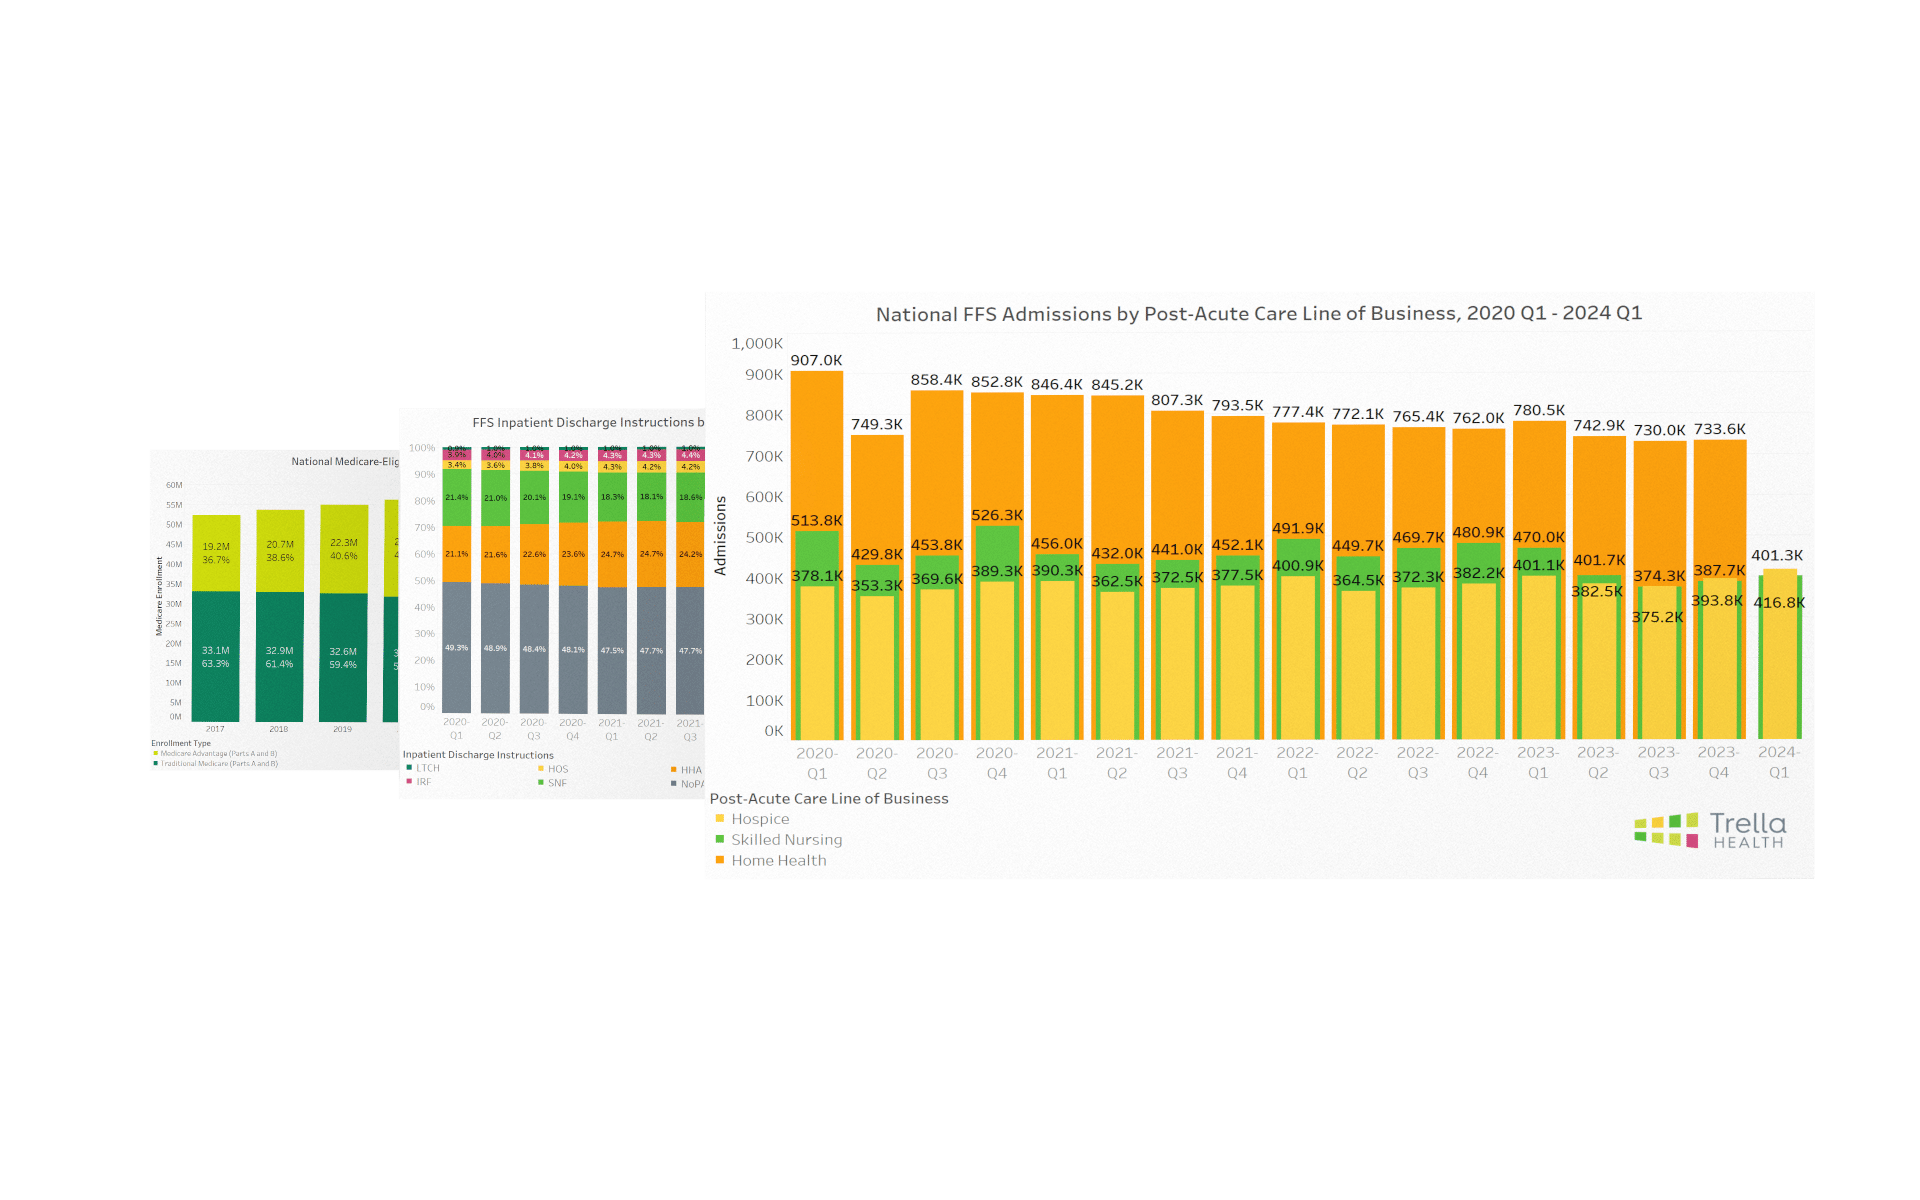
Year-over-year home health FFS admissions increased from 733.3K to 737.6K (+0.59%) between 2024 Q2 to 2025 Q2.
Hospice
Year-over-year hospice FFS admissions increased from 393.3K to 409.6K (+4.14%) between 2024 Q3 and 2025 Q3.
Skilled Nursing
Year-over-year skilled nursing FFS admissions decreased by -0.18%, from 380.2K in 2024 Q3 to 379.5K in 2025 Q3.
")
Home Health
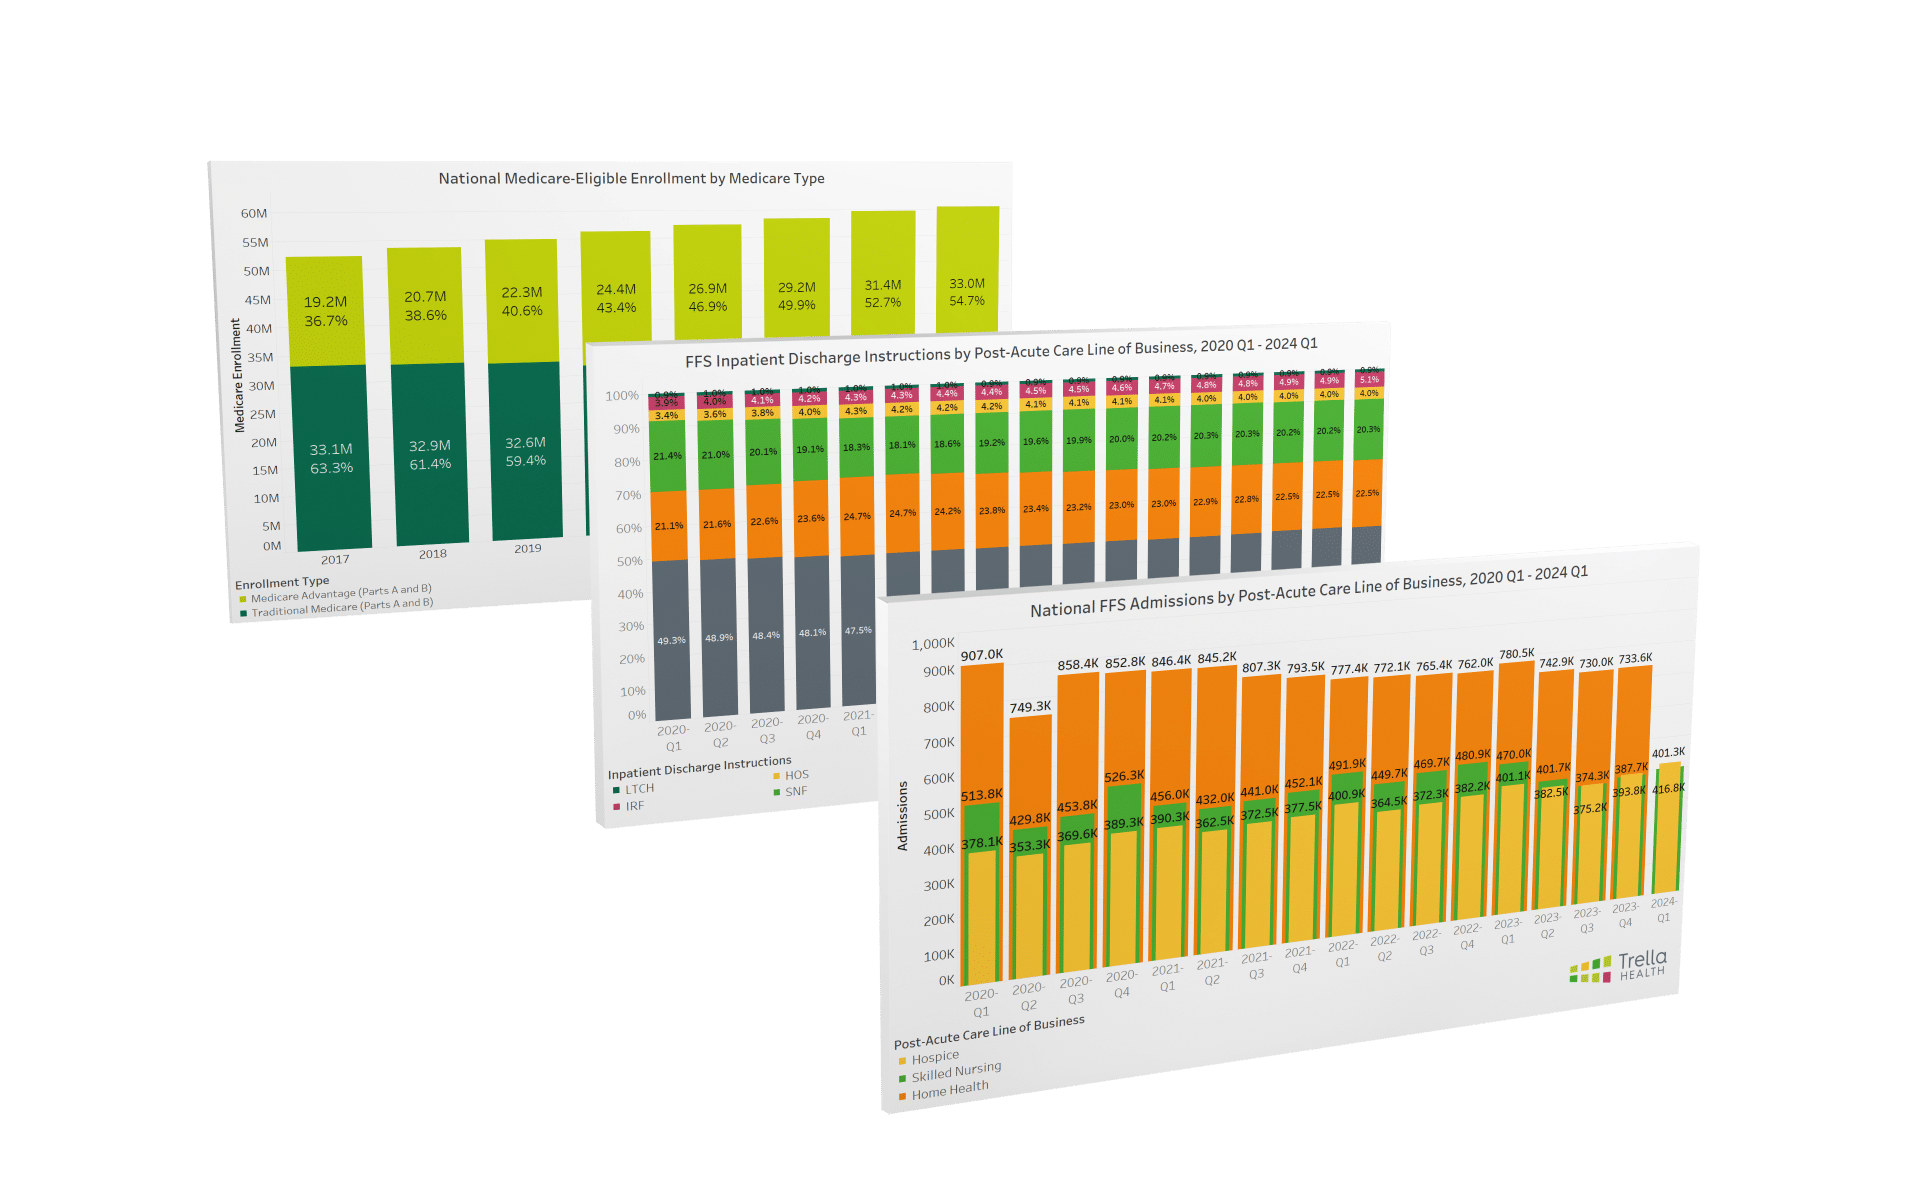
The percentage of inpatient stays instructed to seek home health services minimally fluctuated between the rolling four quarters ending in 2025 Q3 (22.7%) and the rolling four quarters ending in 2024 Q3 (22.6%).
Hospice
The percentage of inpatient stays instructed to seek hospice services slightly increased between the rolling four quarters ending in 2025 Q3 (4.1%) and the rolling four quarters ending in 2024 Q3 (4.0%).
Skilled Nursing
The percentage of inpatient stays instructed to seek skilled nursing care decreased slightly between the rolling four quarters ending in 2025 Q3 (20.2%) and the rolling four quarters ending in 2024 Q3 (20.3%).
")
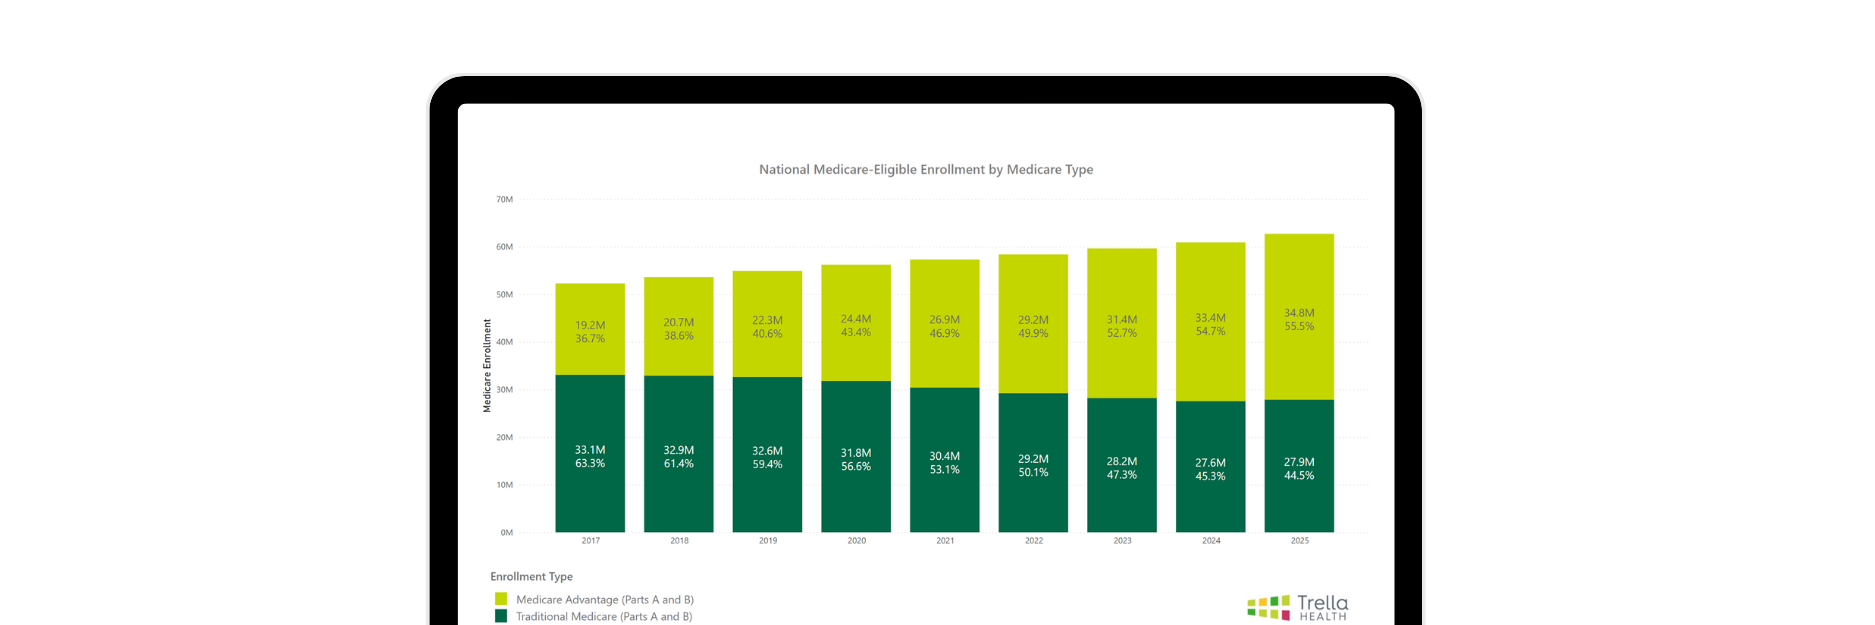
Medicare Advantage enrollment continues to grow. Medicare beneficiaries enrolled in a Medicare Advantage plan represented 55.5% of beneficiaries enrolled in both Medicare Parts A and B in 2025, a continued increase from 2024 and a nearly 19-percentage point increase from 2017.
*Note about FFS admissions data:
FFS home health, hospice, and skilled nursing admissions are based on claims initially released by CMS to their virtual research data center and accessible by Trella Health. As such, the true number of admissions could be higher when claims that were filed after the initial release are factored in. Trella Health uses the initially released data for earlier quarters to provide a more accurate directional trend analysis for the latest available data.
**Note about Medicare Advantage enrollment data:
As of December 2023, we’ve refined our Medicare Advantage enrollment data sources from using the “Original Medicare Beneficiaries” and “Medicare Advantage and Other Health Plan Beneficiaries” to using the “Original Medicare Part A and Part B Beneficiaries” and “Medicare Advantage and Other Health Plan Part A and Part B Beneficiaries”. This adjustment aligns the Medicare Advantage and Traditional Medicare enrollment definitions to be more similar.

As part of our mission to promote industry-wide performance visibility, we are excited to share the findings of this year’s Post-Acute Care Industry Trend Report.
Part A and B claims from CMS

Medicare lives are represented

of all lives 65+ in the United States

claims analyzed annually

users across 700+ customers


