Carter Bakkum, Senior Consultant, Data & Analytics
Carter is a Senior Consultant of Data & Analytics who works to turn complex, messy data into actionable intelligence. Carter studied economics and statistics at the University of Virginia before joining an economic consulting firm, where he supported expert testifying economic witnesses on behalf of fortune 500 healthcare companies. After the significant changes in the importance of data analytics during the pandemic, Carter joined the Trella team to dive deeper into the numbers to uncover the stories that drive our experience.![]()
Blog
Average Length of Stay by Diagnostic Category for Post-Acute Care Providers
By Carter Bakkum | May 26, 2022
Average length of stay by diagnostic category for home health discharges 2021 Q1 – 2021 Q4
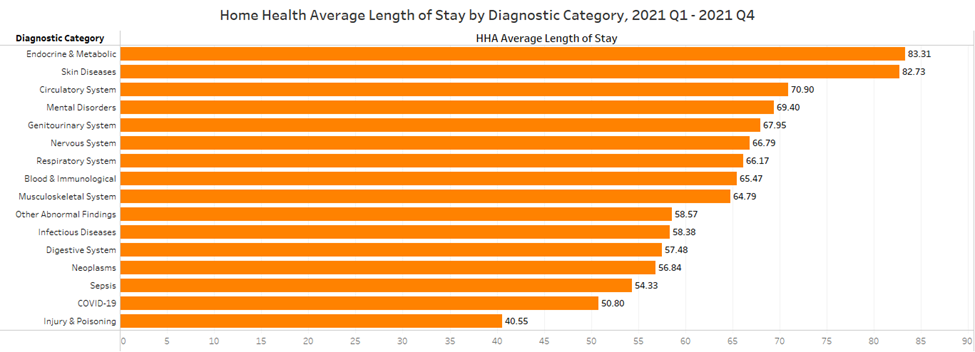
Above is a chart depicting average length of stay by diagnostic category for home health discharges between 2021 Q1 and 2021 Q4. Injury and poisoning episodes have the shortest length of stay by far at 40.6 days while endocrine and metabolic episodes have the highest at 83.3. The largest group of episodes by volume for home health, circulatory system, has an ALOS of 70.9. Most diagnostic categories fall between 50.8 and 70.9.
Average length of stay by diagnostic category for hospice discharges 2021 Q1 – 2021 Q4
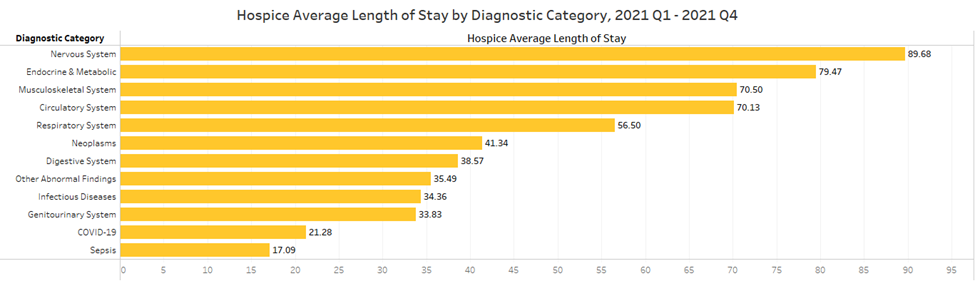
Above is a chart depicting average length of stay by diagnostic category for hospice discharges between 2021 Q1 and 2021 Q4. Note that the graph is limited to diagnostic categories with more than 5,000 discharges in the most recent reporting period. Unsurprisingly, sepsis and COVID-19 patients have the lowest length of stay, as these diagnostic categories generally contain patients with sudden, acute diagnoses that result in a relatively quick death. Nervous system episodes have the highest length of stay, approach 90 days. Interestingly, neoplasms episodes have an ALOS of 41.3. There is typically a long time between a cancer diagnosis and death so it’s surprising that the ALOS is low compared to respiratory, circulatory, and musculoskeletal episodes. However, with many available treatments it’s possible that beneficiaries explore all avenues for a cure before entering hospice care.
Average length of stay by diagnostic category for skilled nursing discharges 2021 Q1 – 2021 Q4
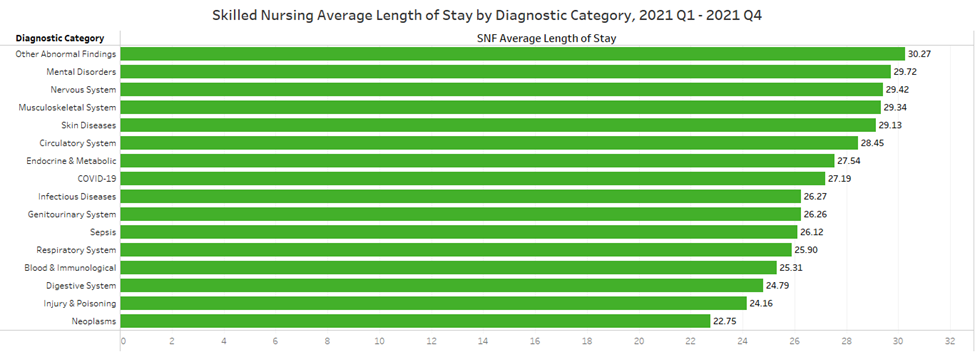
Above is a chart depicting average length of stay by diagnostic category for skilled nursing discharges between 2021 Q1 and 2021 Q4. The average length of stay for skilled nursing facilities is more concentrated than for home health and hospice agencies with a difference in the highest and lowest ALOS of 8 days compared to 73 and 44 for hospice and home health, respectively. Other abnormal findings and mental disorder episodes have the highest ALOS while injury and poisoning and neoplasms have the lowest ALOS.
About the data and more information
This analysis is limited to Medicare Fee-for-Service (FFS) beneficiaries and uses Trella’s access to 100% of Medicare Part A and Part B claims data. Diagnostic categories are determined by ICD 10 diagnosis codes. For more information on what diagnoses are included in each category, visit this help page. For more analyses into Medicare data and how data illustrates the importance of post-acute care and how to take advantage of changing healthcare, all my analyses are saved on my author page, linked here.
About the Author:
