Carter Bakkum, Senior Consultant, Data & Analytics
Carter is a Senior Consultant of Data & Analytics who works to turn complex, messy data into actionable intelligence. Carter studied economics and statistics at the University of Virginia before joining an economic consulting firm, where he supported expert testifying economic witnesses on behalf of fortune 500 healthcare companies. After the significant changes in the importance of data analytics during the pandemic, Carter joined the Trella team to dive deeper into the numbers to uncover the stories that drive our experience.![]()
Blog
2021 SNF Data: Does Lower ALOS Impact Quality Metrics?
By Carter Bakkum | August 18, 2021
Recently, we explored a few key metrics for successful SNF ACO participation in 2021. Accountable Care Organization (ACO) participation is highly attractive for a lot of skilled nursing facilities (SNFs) in the transition to value-based care from fee-for-service payment models. Under the umbrella of a strong network, SNFs can take part in shared savings programs and reap the benefits of improving costs and patient outcomes.
However, not all SNF leaders are convinced of the merits of joining ACOs. In fact, decreased quality of care is one of the most common criticisms that SNFs level against ACOs. On the surface, these fears seem logical. It makes sense that ACOs’ heavy emphasis on shorter stays could negatively impact patient outcomes. As an anonymous SNF operator told Skilled Nursing News in 2019, ACOs’ insistence on lowering average length of stay (ALOS), combined with a preference to funnel participants into lower-cost home health agencies, can result in higher hospitalization and readmission rates.
Is this actually the case, though? To determine if lower ALOS rates could harm SNFs’ quality metrics, the Trella team looked to the data. Using Trella’s access to 100% of Medicare Parts A and B claims, along with ACO affiliation information provided by the Center for Medicare and Medicaid Services (CMS), we conducted an investigation into whether lowered ALOS results in higher hospitalizations and/or readmissions, adjusted by risk score.
Methodology
We identified and analyzed data from 308 ACO-affiliated SNFs and 1,936 unaffiliated SNFs in 2019. All of these SNFs were located in similar geographic areas to ensure that we were analyzing similar facilities and to eliminate differences in performance metrics across markets. This allowed us to investigate whether ACOs’ preference for lower ALOS resulted in higher hospitalization and readmissions rates for SNFs in a similar geographic area with similar demographics for patient populations.
ALOS v. Risk Score
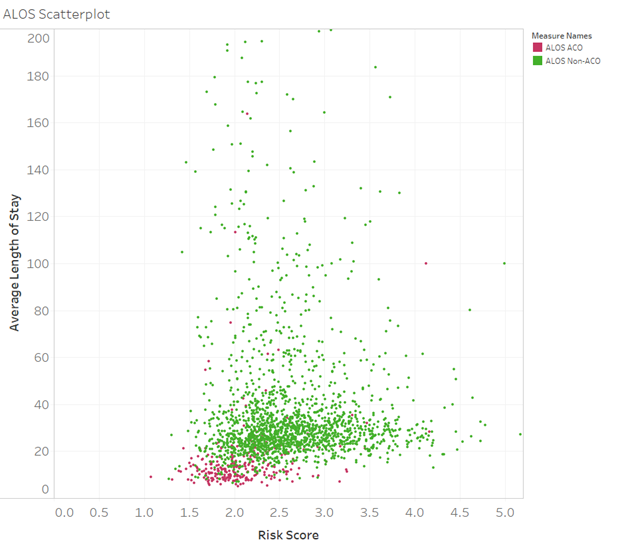
As we discussed in our previous blog, ACO-affiliated SNFs tend to have much lower ALOS than nonaffiliated SNFs. Chart 1 illustrates this trend by plotting the ALOS for affiliated and unaffiliated SNFs’ ALOS against the average risk score of their patient population. Overall, for patients with similar acuity, ACO-affiliated SNFs tend to have much lower ALOS, compared with their unaffiliated counterparts. This pattern is likely a result of two factors:
- ACO-affiliated SNFs are typically chosen specifically for their lower ALOS in comparison with other SNFs in their geographic area.
- ACO-affiliated SNFs likely experience more pressure to decrease ALOS than unaffiliated SNFs.
Due to the increased pressure on ACO-affiliated SNFs to lower ALOS, we might expect certain patient outcomes – such as hospitalization and readmission rates – to be worse for these SNFs than for SNFs with higher ALOS rates. But is that actually the case?
Risk Score v. Hospitalization Rates
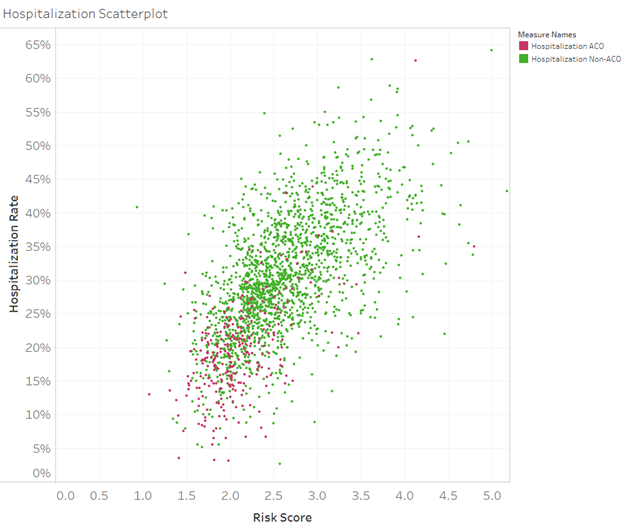
To determine if lower ALOS results in poorer outcomes, chart 2 plots risk score along the X-axis and hospitalization rate along the Y-axis. Each dot in the graph represents a SNF, with red dots representing hospitalization rates for ACO-affiliated SNFs and green dots representing hospitalizations rates for nonaffiliated SNFs. If lower ALOS rates impacted hospitalization rates (for patients with the same level of acuity), ACO-affiliated SNFs would appear higher along the same vertical line than unaffiliated SNFs. As you can see, though, that is clearly not the case. From our findings, this chart demonstrates that, despite lower lengths of stay, patients treated at ACO-affiliated SNFs tend to have lower 30-day hospitalization rates than patients at unaffiliated SNFs. This pattern is at the core of what ACOs are meant to do: reduce spending on healthcare while improving patient outcomes.
Risk Score v. Readmission Rates
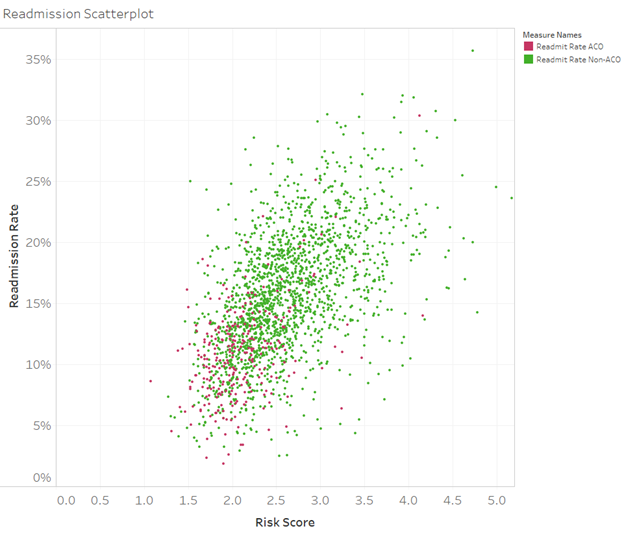
Our findings for hospitalization rates indicate that there’s likely not a correlation between lower ALOS and increases in risk score, but what about readmission rates? Chart 3 illustrates readmission rates for ACO-affiliated and unaffiliated SNFs compared to risk scores. Though the results are not as pronounced as they were for hospitalization rates, we can observe a similar trend. Once again, if lower lengths of stay resulted in higher readmissions, we would see more red dots higher up along the Y-axis in comparison with their unaffiliated counterparts. Just as this wasn’t the case for hospitalization rates, it is also not the case for readmission rates. In some of the worst instances, readmission rates are on par with unaffiliated SNFs, and many ACO-affiliated SNFs actually demonstrate lower readmission rates than unaffiliated SNFs for patients of similar acuities.
Next Steps
The data for hospitalization and readmission rates for patients of similar acuity in the same geographic areas indicates that lower ALOS rates will likely not have a negative impact on patient outcomes. In many cases, ACO-affiliated SNFs with lower ALOS rates also show decreased readmission and hospitalization rates, too. As we mentioned earlier, this indicates that ACOs are making progress in the goal of decreasing costs, providing patients with the right care in the right settings, and improving patient outcomes.
SNF leaders concerned about key metrics for cost and patient outcomes can benefit from access to 100% of data for Medicare Part A and B claims. With this data, you can gain insight into areas where your SNF stands out and how you can improve quality of care while controlling costs. This data can help you stand out as a potential ACO affiliate and a better partner to referral sources.
Trella Health is the leader in market intelligence for the 65+ population, with extensive data sets including Medicare FFS, Medicare Advantage, commercial payers, ACOs, and DCEs. To uncover potential growth opportunities in your market and learn more about how data insights and analytics for key metrics can help you control costs, improve patient outcomes, and build a stronger referral network, schedule a demo today.
About the Author:
