
How can skilled nursing facilities (SNFs) thrive in the transition from traditional Medicare fee-for-service (FFS) plans to newer Medicare Advantage (MA) plans. Both MA plans and traditional Medicare FFS plans offer reimbursement for SNF stays, provided certain criteria are met. However, providers participating in MA plans have the freedom to choose which SNFs they include in their network. Thus, it is essential for SNFs to have a strong grasp on data surrounding MA discharges to SNFs in their markets.
To thrive under MA and other value-based payment plans, SNFs must have a clear view of the acute and post-acute care landscape in their markets. Toward that end, the Trella team is constantly working to contribute actionable data and insights to the ever-growing literature comparing healthcare quality, cost, and usage between MA and Medicare FFS patients. As SNF usage rates become clearer and trends emerge, SNF leaders with access to the right data can make informed decisions to stand out as preferred referral partners for hospitals and health systems in their markets.
Methodology
For the purposes of this investigation, the Trella team utilized 100% of Medicare Part A and Part B FFS claims data from 2018 and 100% of Medicare Advantage claims data from the same year. Our aim is to understand the differences in SNF usage between traditional Medicare and Medicare Advantage plans, and to explore how those differences vary from state to state. Access to these results can help inform SNFs where markets are primarily MA-driven and when they may need to consider expanding in-network talks with local MA plans.
Medicare Advantage Penetration by State
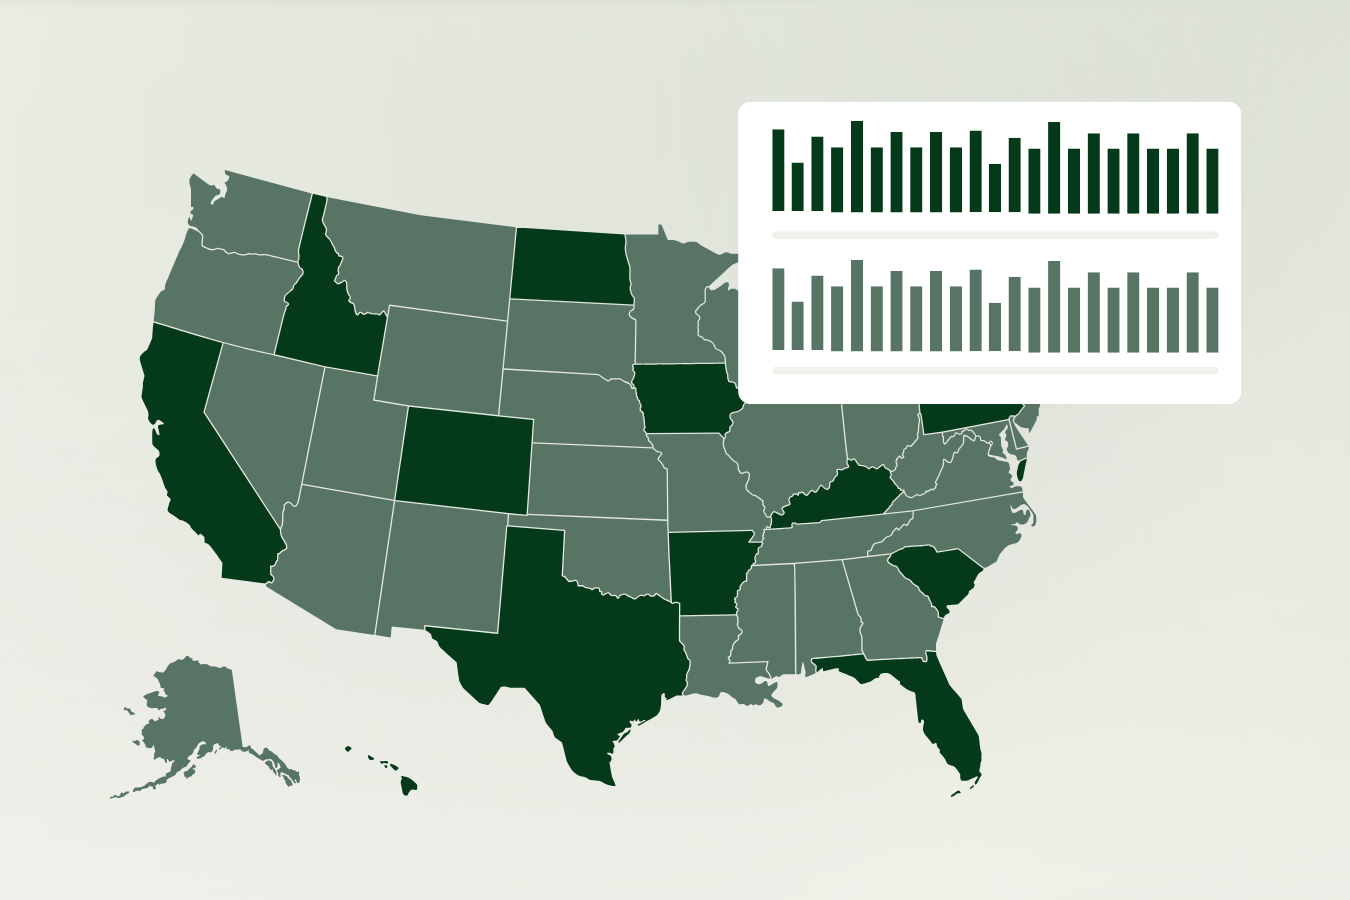
In our first graph below, you can see the variability of MA penetration on a state level. Exploring these results allows us to establish a baseline expectation of the overall percentage of SNF patients covered by MA plans in each state.
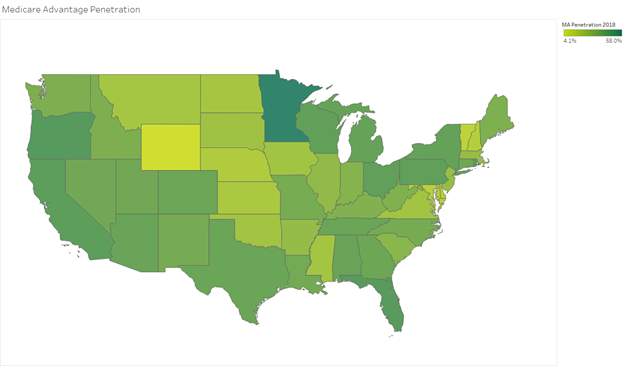
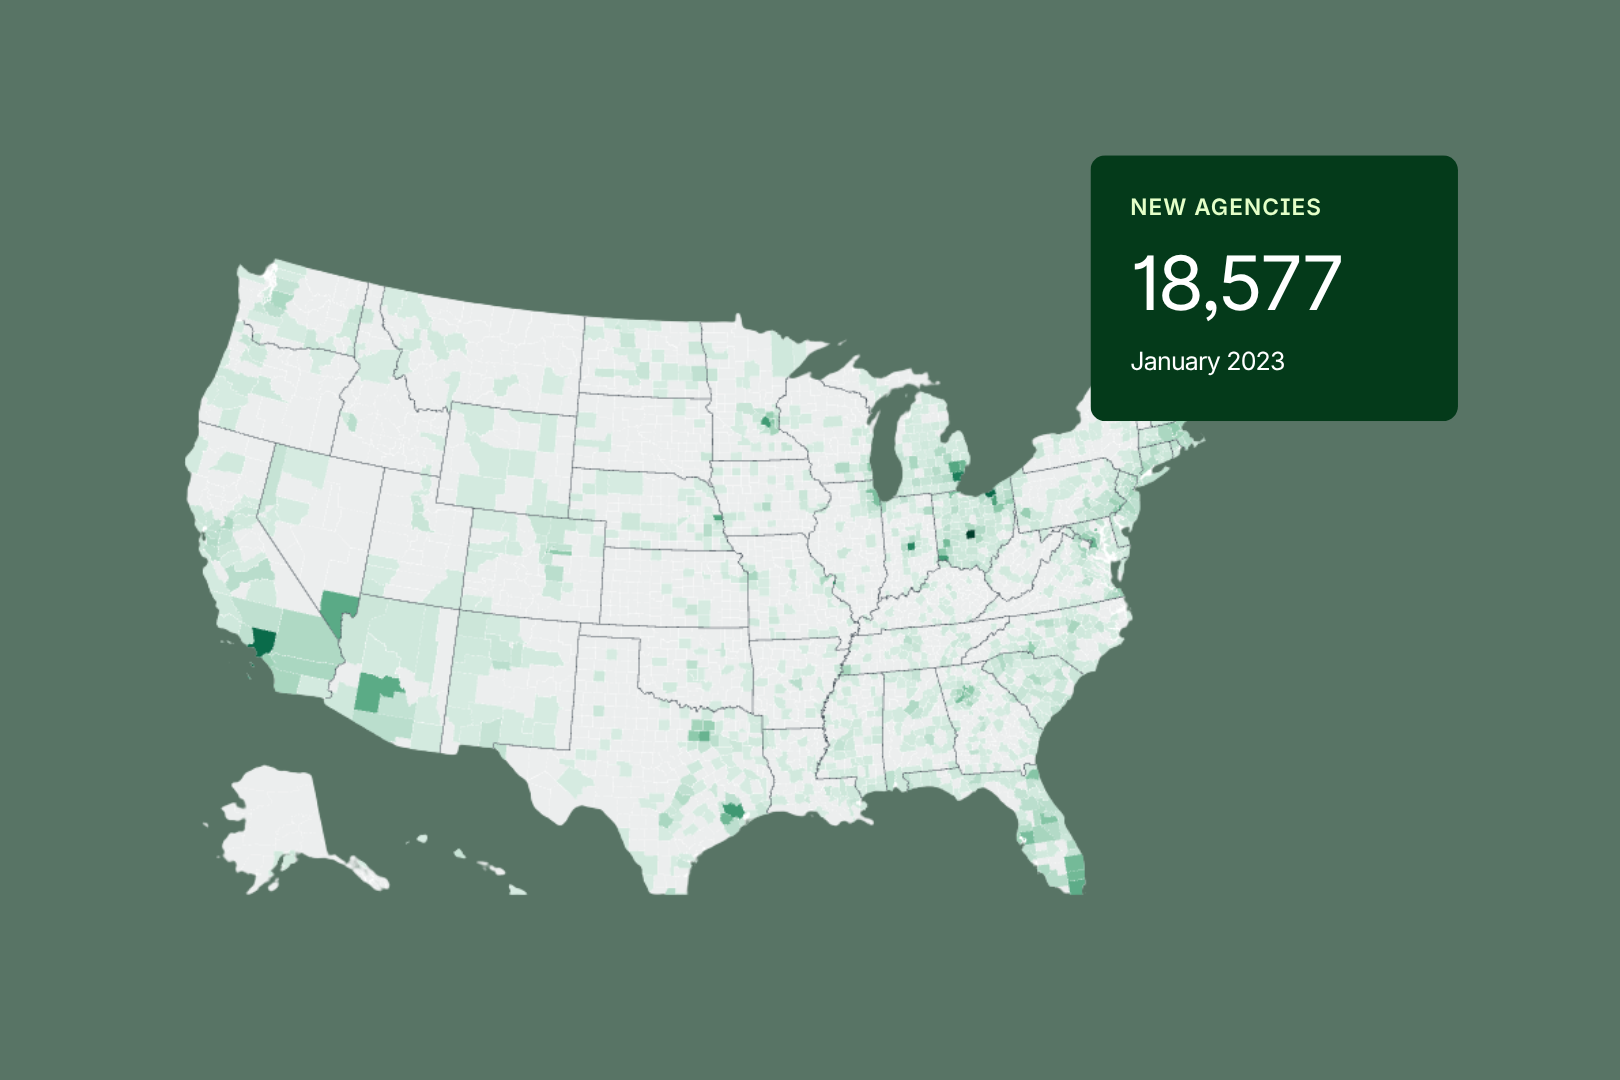
From these results, you can see, as Trella has previously observed, there is significant concentration of MA penetration in urban centers. You can see this more distinctly in the county-level map, also included here for reference. For example, while California as a state does not see as much MA penetration as some other states, you can see significantly higher penetration percentages in the counties surrounding Los Angeles and San Francisco. And you can see a similar instance in the counties around Dallas and Houston in Texas, as well. Similar phenomena occur around New York City and Miami.
Medicare Advantage Penetration by County
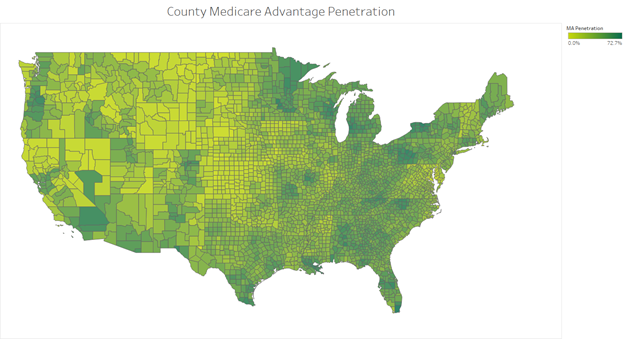
Thanks to these variations, SNFs operating in large states covering multiple markets may benefit most from examining the MA penetration in their county and surrounding counties. However, in a state with an individual market – for example, Maryland – county- and state-level penetration should be roughly equivalent, since the state-level penetration rate gives a sense of the distribution of MA versus FFS patients residing in the state.
Percentage of Patients Covered by Medicare Advantage
The graph below indicates the percentage of SNF patients covered by Medicare Advantage on a state level. In investigating this data, the Trella team noted that roughly half of all states reported MA penetration in similar volume (within 5%) to MA SNF population rates. That said, there were some striking outliers. For example, Minnesota showed a 33-percentage point difference between MA penetration rate and MA SNF population rate. While MA plans covered 58% of eligible lives in the state, only 25% of SNF admissions were covered by MA plans. We also noted similarly large differences in penetration versus SNF admissions in New York and Florida, with SNF admissions at 21.4 and 19.7 percentage points, respectively.
Next Steps: Know Your Market
It’s imperative for SNFs to understand the Medicare Advantage penetration rate in their market. However, it is even more important to understand whether the MA penetration rate is similar to the actual MA SNF admissions population. If your state covers multiple markets and your facility is located in a rural area, your market’s SNF admissions covered by MA may be much lower than your state’s MA coverage rate. By exploring the data for your market on a more granulated level, you can more accurately identify the percentage of your patients covered by Medicare Advantage versus Medicare FFS. You can then identify areas where your SNF stands out to improve patient outcomes and set your organization apart as a preferred referral partner and attractive candidate for in-network partnership.
Trella Health is the leader in market intelligence for the 65+ population, with extensive data sets including Medicare FFS, Medicare Advantage, commercial payers, ACOs, and DCEs. For more insights into growth opportunities in your market, schedule a demo today.