

Trella Health Blogs
Explore expert insights, market-leading reports, and practical strategies powered by the healthcare intelligence trusted by leading organizations across the care continuum — helping teams make smarter decisions and drive healthier outcomes.

Blog
Blog
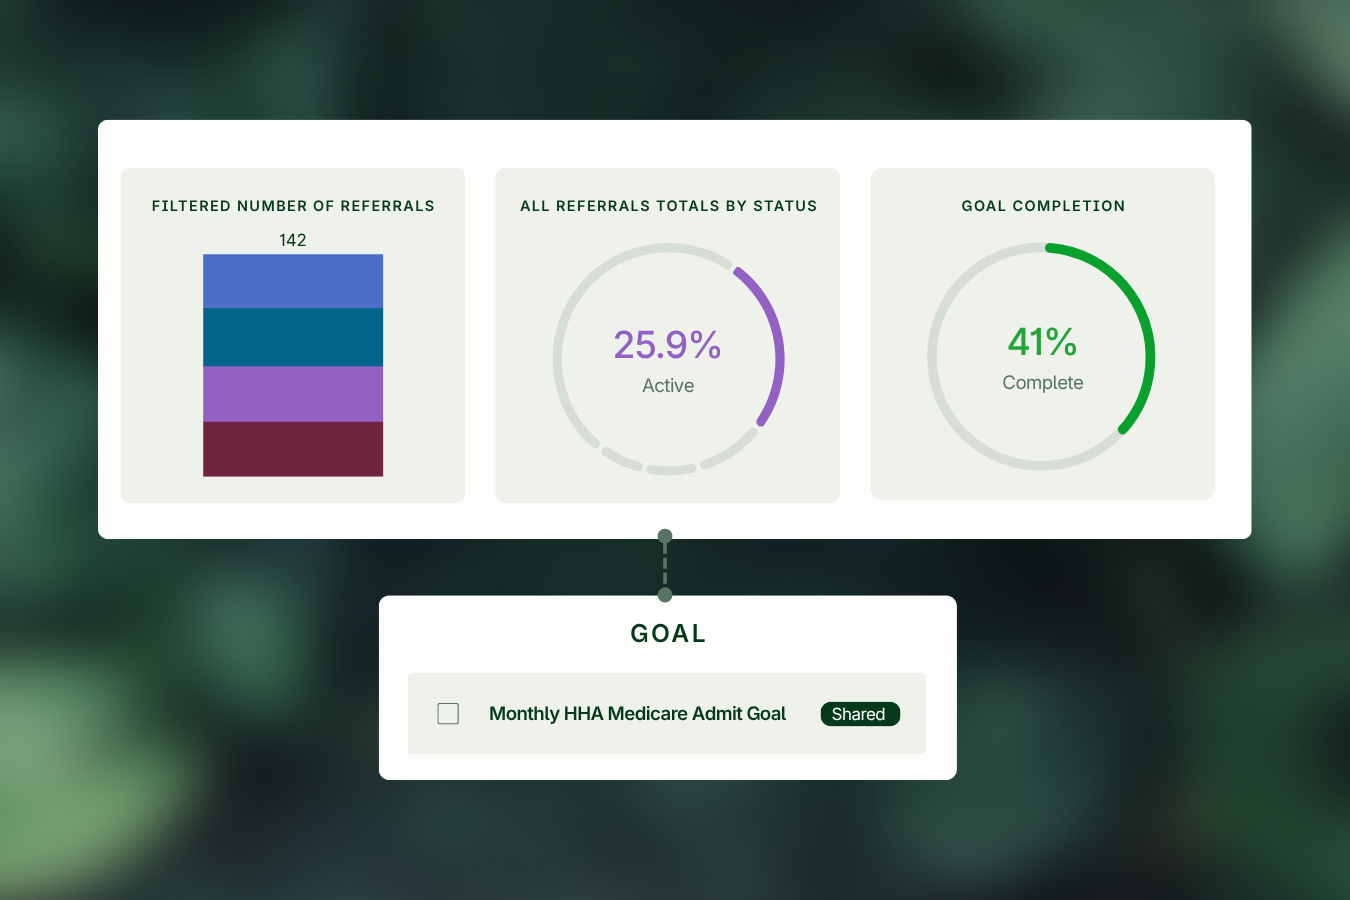
Why Goal Setting in Healthcare Sales Needs to Move Beyond Spreadsheets with…
This blog explores why modern goal setting needs to be embedded directly into sales workflows and how Trella Health’s CRM Goals feature helps healthcare organizations create, track, and manage goals that drive measurable results. In post-acute, HME, DME, and infusion sales, performance management has always depended on clear goals. Sales leaders need to know whether […]
Read More 
Blog
Blog
How Infusion Providers Are Turning Referral Data into Revenue Growth
Infusion providers are under increasing pressure to grow efficiently in a competitive, high-cost environment. As infusion therapy expands due to clinical innovation, an aging population, and the shift toward outpatient and home-based care, infusion services are becoming a crucial component of modern healthcare delivery. Traditional strategies built on referral volume and relationship-based outreach are no […]
Read More 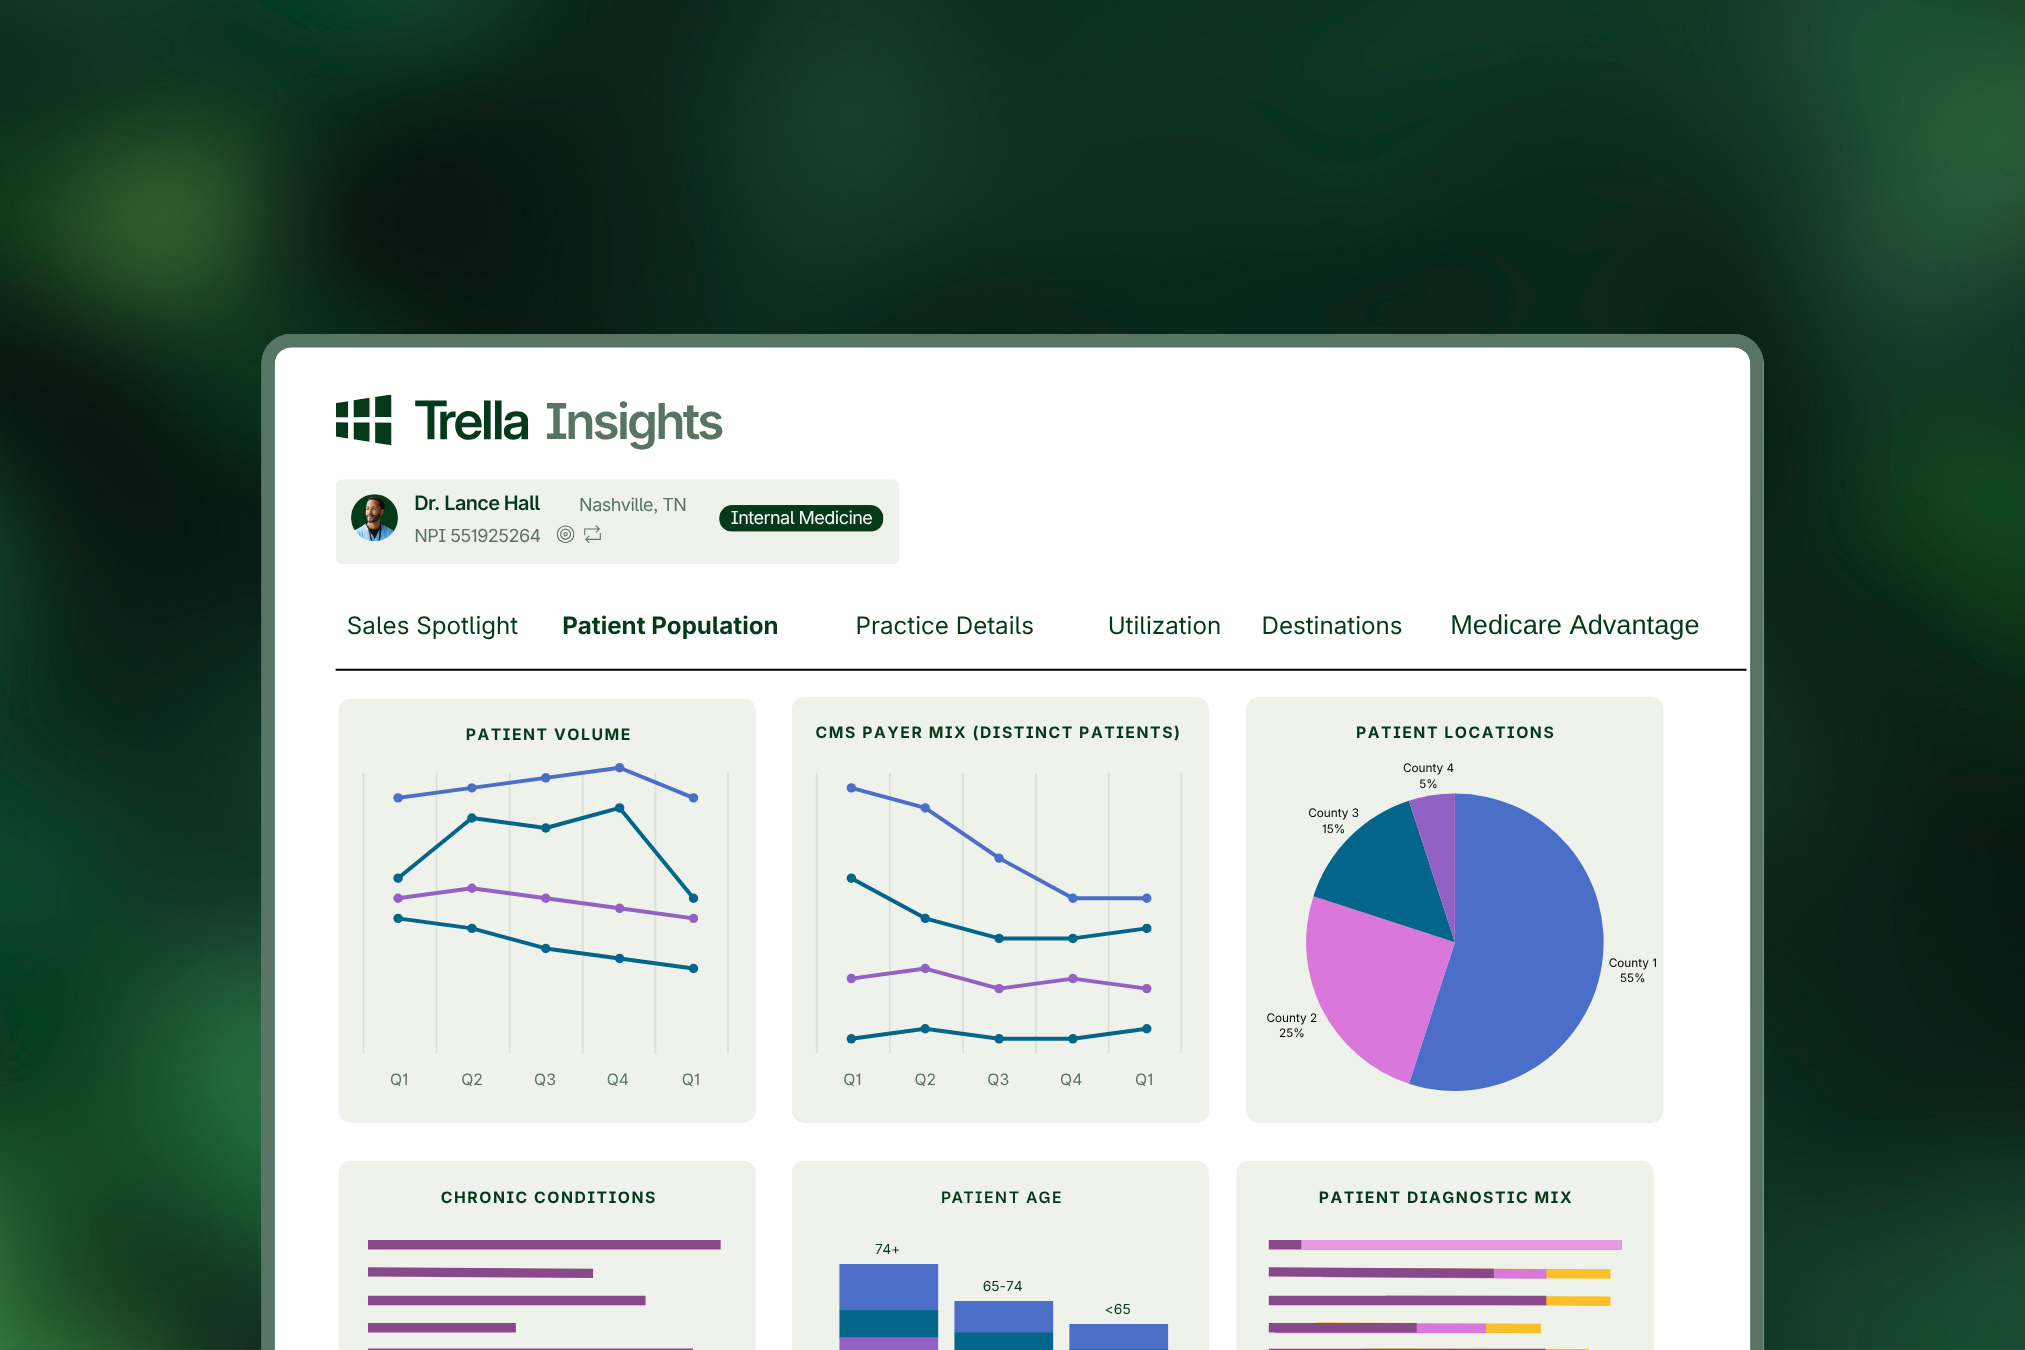
Blog
Blog
How Post-Acute SaaS Platforms Are Replacing Spreadsheets and Gut Instinct
In post-acute care, growth strategies have long relied on a familiar toolkit: spreadsheets, fragmented data sources, and institutional knowledge built over years of relationship management. While these methods once served as a foundation for decision-making, they are increasingly outpaced by the complexity of today’s healthcare landscape, where organizations face challenges such as increased administrative burden […]
Read More 
Blog
Blog
Stop Targeting the Wrong Physicians: How Infusion Referral Data Reveals Where to…
Infusion sales teams often rely on outdated referral lists and assumptions, missing high-volume prescribers and losing market share. This blog explores the cost of targeting the wrong physicians and how claims-based medical and pharmacy data reveals real prescribing activity, competitive relationships, and growth opportunities. What Is the “Infusion Referral Blind Spot”? The infusion referral blind […]
Read More 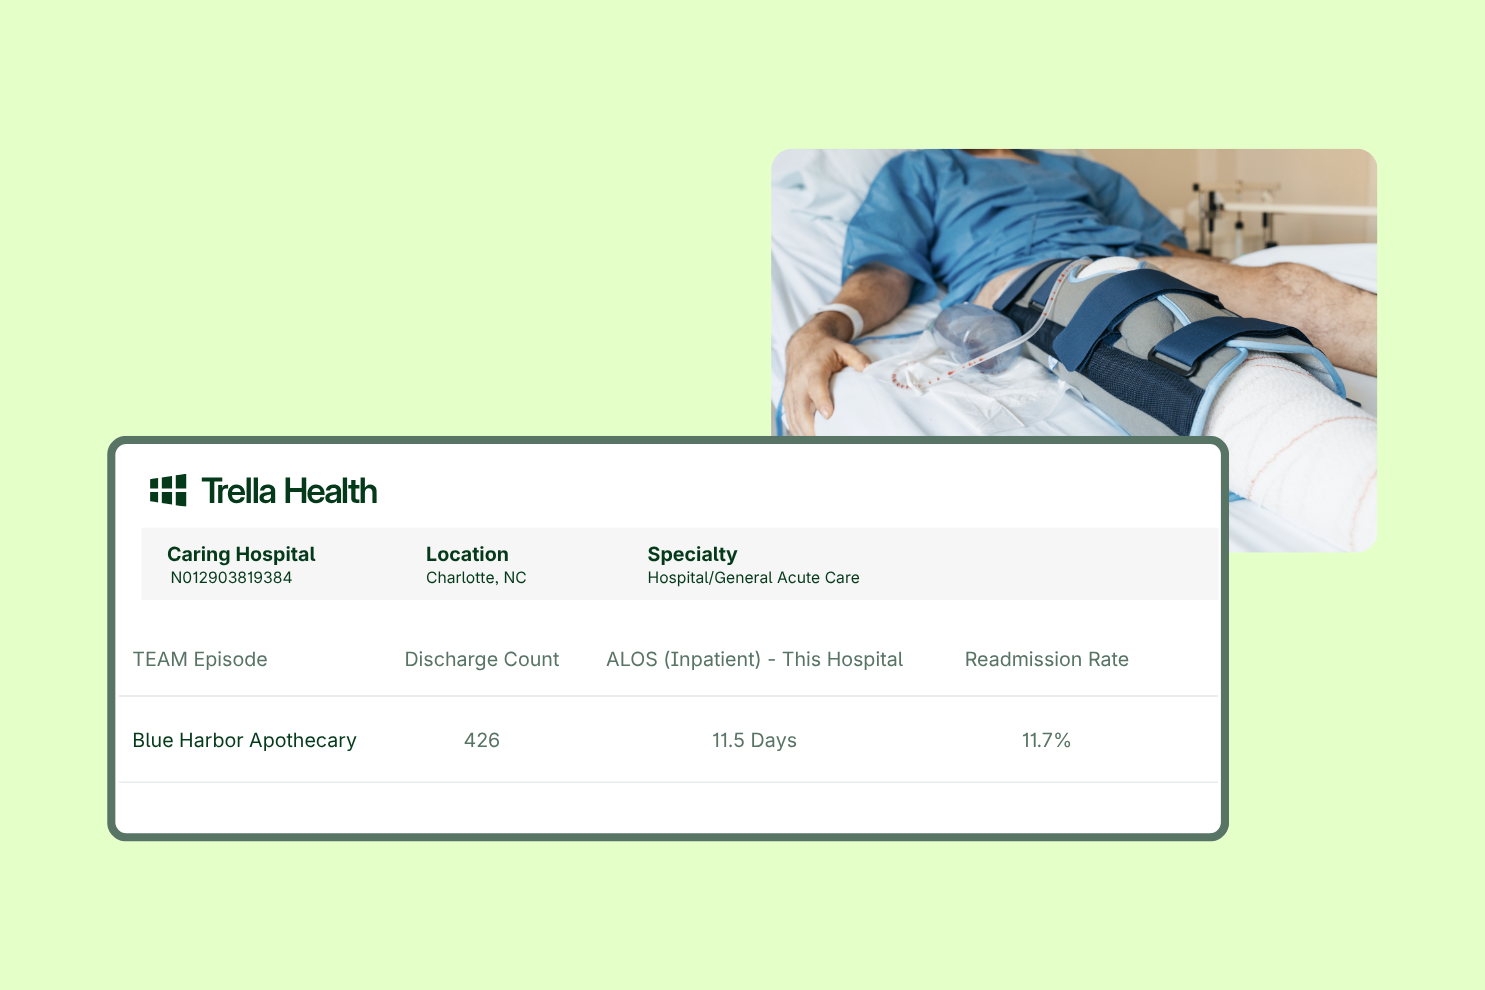
Blog
Blog
Winning Under TEAM: Why Care Transitions Will Define Financial and Clinical Performance…
As healthcare shifts further into value-based models, care transitions are emerging as one of the most critical and controllable drivers of both cost and patient outcomes. With the Transforming Episode Accountability Model (TEAM) now in effect as of January 1, 2026, hospitals are facing a new level of accountability that extends well beyond the inpatient stay. A joint analysis […]
Read More 
Blog
Blog
Hospital Readmission Reduction Program: How Post-Acute Providers Can Reduce Readmissions and Avoid…
The Hospital Readmission Reduction Program (HRRP) has made 30-day readmissions a key driver of hospital penalties, extending accountability to post-acute providers. As a result, outcome transparency, strong care coordination, and data-driven performance are now essential to reducing risk and maintaining competitive partnerships. This blog explores how post-acute providers can address these challenges and improve readmission […]
Read More
Blog
Blog
Evaluating Market Expansion Opportunities Using Claims Data in Healthcare
Market expansion in post-acute care requires more than intuition. Entering a new geography, service line, or patient population demands a clear understanding of referral dynamics, competitive presence, and payer mix. Claims data provides the visibility leaders need to evaluate these factors and determine whether a market truly supports growth. The following framework outlines how organizations […]
Read More
Blog
Blog
The Hidden Cost of Using a Mileage Tracking System Outside Your CRM
When mileage tracking lives outside the CRM, it can create hidden costs from inaccurate reimbursements to limited visibility into travel patterns. This blog explores five common challenges organizations face with disconnected mileage tracking and how integrating it into the CRM can improve accuracy, efficiency, and operational insight. For post-acute care organizations, field representatives spend a […]
Read More
Blog
Blog
Why Data Analytics Are a Non-Negotiable Under the New ACO LEAD Model
This blog explores what LEAD means for the post-acute market, why “Preferred Provider” status will become more competitive, and how data transparency will determine strategic relevance. It also outlines how Trella Health equips providers with claims-backed insights, such as Total Cost of Care analytics and Hospice Timing Impact metrics, to quantify value, strengthen ACO partnerships, […]
Read More
Blog
Blog
5 Major Discharge Planning Challenges Health Systems Face — and How Automation…
Effective discharge planning is critical to hospital performance, directly impacting length of stay, readmissions, patient satisfaction, and operational costs. Yet many health systems still rely on manual, fragmented workflows that slow care transitions and strain staff resources. By adopting EHR-integrated discharge automation, hospitals can streamline referrals, improve post-acute placement, and strengthen outcomes across the continuum […]
Read More
Blog
Blog
Quantifying the Financial and Utilization Impact of Early Hospice Care Enrollment
Early hospice enrollment is widely recognized for improving end-of-life care, yet its financial and utilization impact has often been difficult to quantify. This blog explores how claims-based analytics are transforming that conversation by providing objective evidence that shows how the timing of hospice enrollment directly influences Medicare spend and hospital utilization. Hospice care is a […]
Read More
Blog
Blog
Overcoming Objections in Post-Acute Care Sales: A Smarter, Scalable Approach with Sales…
As referral patterns evolve and performance expectations rise, sales leaders must develop high-performing teams without adding unnecessary complexity or risk. Sales teams need to quickly adapt to evolving regulations and market dynamics to stay competitive. Despite the proven value of coaching, many post-acute care (PAC) organizations hesitate to formalize their approach. Concerns around time, credibility, […]
Read More