National Medicare Advantage penetration held at 55.4% through January 2026 after increasing by an average 2.1 percentage points annually since 2017. Thirty states now have Medicare Advantage penetration above 50%, including 14 states above 60%.
New This Year: Our Annual Report Goes Interactive
Post-Acute Market Intelligence Report: 2026 Edition
This year’s Post-Acute Market Intelligence Report isn’t a report you simply read. It’s one you use. Every chart is interactive. Select any state or combination of markets, toggle between metrics, and hover to see the exact figures behind every trend. From admissions and utilization to quality, cost of care, and TEAM readiness, the report provides national benchmarks and lets you drill down to the markets where you operate.
Trends by Industry:
Trends by Industry:
Hear From Trella Health’s CEO
A note from Scott Tapp
Notable Insights
Key trends shaping post-acute growth and performance
Medicare Advantage
National Medicare Advantage Penetration
For nearly a decade, Medicare Advantage moved one way: up and to the right. That paused this year. Through January 2026, national MA penetration held at 55.4%, flat after gaining 18.7 points since 2017. January is only the first read on the year, not the full picture, but the shift is real and worth watching. For the first time in years, Fee-for-Service grew nearly as fast as MA (+348K vs. +361K). Underneath the flat line, penetration fell in 22 states, largely where carriers exited. Vermont is the sharpest — major plans didn’t renew, and penetration collapsed from 33.5% to 13.7% in a year, sending 30,000+ beneficiaries back to Fee-for-Service.
Medicare Advantage
Medicare Advantage Penetration by State
Medicare Advantage penetration is higher than in 2017 across 49 states, but the map is anything but uniform. Penetration spans a 64-point gap, from Michigan’s 67.4% to Alaska’s 3.1%, shaped by decades of plan availability, regional preference, and network economics. Thirty states now sit above 50% and 14 above 60%, while a handful of rural, low-density markets remain firmly Fee-for-Service.
Medicare Advantage
Medicare Advantage Post-Acute Care Reach by Payer
The ten largest Medicare Advantage payers control 81% of national MA enrollment, and with it, an outsized share of post-acute referrals. This view compares each payer’s share of home health and SNF patients against its share of MA enrollment, exposing where a plan’s post-acute footprint runs ahead of or behind its enrollment. This gap elucidates which payers post-acute agencies should prioritize contracting not just based on their enrollment, but how these plans incentivize the usage of home health and SNF services. Figures reflect 2023, the latest year with payer-level utilization data.
Post-Acute Discharge
Inpatient Discharges by Post-Acute Care Instruction
How inpatient discharge instructions split across care settings shapes the entire downstream post-acute market. That split has been quietly reweighting: home health rose to 22.6% of FFS inpatient discharge instructions in 2025 while skilled nursing slipped to 20.0%, reversing their 2019 order and making home health the leading directed post-acute destination. This chart breaks annual discharge instructions into all six destinations, nationally and for every state, from 2019 through 2025.
Post-Acute Discharge
PAC Instructional and Adherence Variation by State
Two metrics have a strong influence on whether a hospital discharge becomes a post-acute admission: how often patients are instructed to PAC, 53.0% of FFS discharges in 2025, and how often they follow that instruction. Adherence to inpatient discharge instructions ranges from 90.5% for hospice down to 70.7% for home health. The state maps sharpen the picture: instruction rates span 27.5% to 64.4%, and even hospice adherence — the most reliable in the country — falls to 78.6% in New York.
Post-Acute Discharge
Average Time to Start of Home Health Care after Inpatient Discharge by State
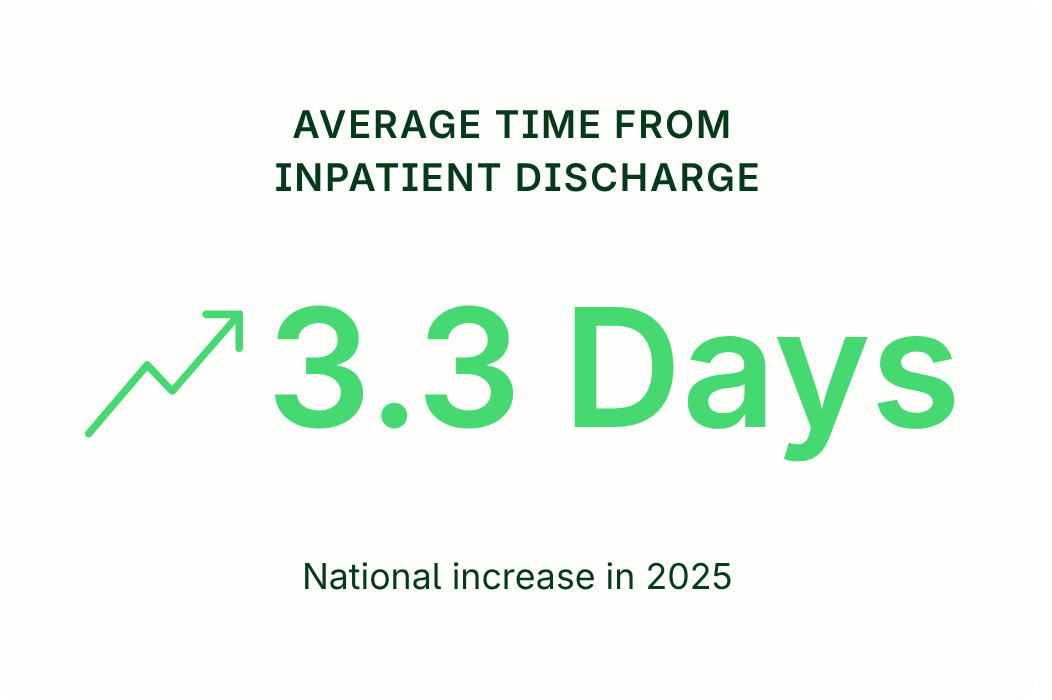
Time to start care is the metric referral sources actually feel. In 2025, the national average rose to 3.3 days, with start times worsening in 39 states. The spread is nearly threefold: Louisiana starts care in 2.3 days, Hawaii in 6.5 days.
Home Health
Home Health Admissions by Quarter
FFS home health admissions continued to decline amid the ongoing shift toward MA, illustrated by the annual FFS and MA totals beneath the chart. Plateauing MA enrollment could foreshadow a new benchmark for expected FFS home health admissions in the near future.
Home Health
Home Health Utilization, Hospitalization, and Readmissions
The average risk score of FFS home health patients has risen every year since 2020 — from 2.31 to 2.56, and up 7.2% since 2019. Over the same stretch, home health has been the leading post-acute destination, with 22.6% of FFS discharge instructions in 2025. Hospitalization rose for a third straight year (24.2%) and readmissions ticked up to 12.0% — but read those rates against the acuity climb. More complex patients are arriving in higher volume.
Hospice
Hospice Admissions by Quarter
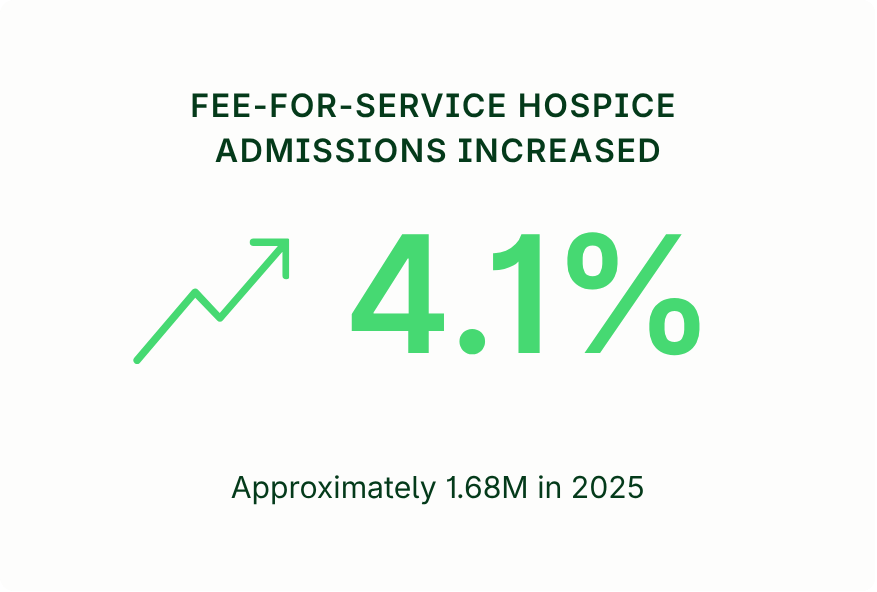
FFS hospice admissions reached 1.68M in 2025, up 4.1%, the fastest annual growth in five years, and the fourth consecutive year the growth rate has accelerated. Unlike home health and skilled nursing, where FFS volume has compressed as enrollment shifts to Medicare Advantage, hospice remains a fee-for-service benefit for nearly all Medicare patients.
Hospice
Hospice Utilization and Average Length of Stay by State
Hospice utilization is rising at roughly a point a year — 51.9% of FFS decedents in 2025, with gains in 50 states over two years. Average length of stay is also increasing, up two days since 2023 to 66.5 days. Longer stays often reflect earlier hospice identification and are associated with lower total cost of care, as quantified in the next section.
Hospice
Cost of Care by Hospice Adoption Timeframe
Patients who enter hospice earlier accrue markedly lower total end-of-life Medicare costs: $68K over the final six months for 2025 decedents with 121+ days on hospice, versus $97K for those who never enrolled. As hospice tenure grows, hospice spending rises — but inpatient spending falls much faster, so the total drops sharply. This is an association, not a controlled effect — earlier-hospice patients differ clinically from those who never enroll — but the pattern underscores the value of early identification for hospices competing in value-based care networks.
Skilled Nursing
Skilled Nursing Admissions by Quarter
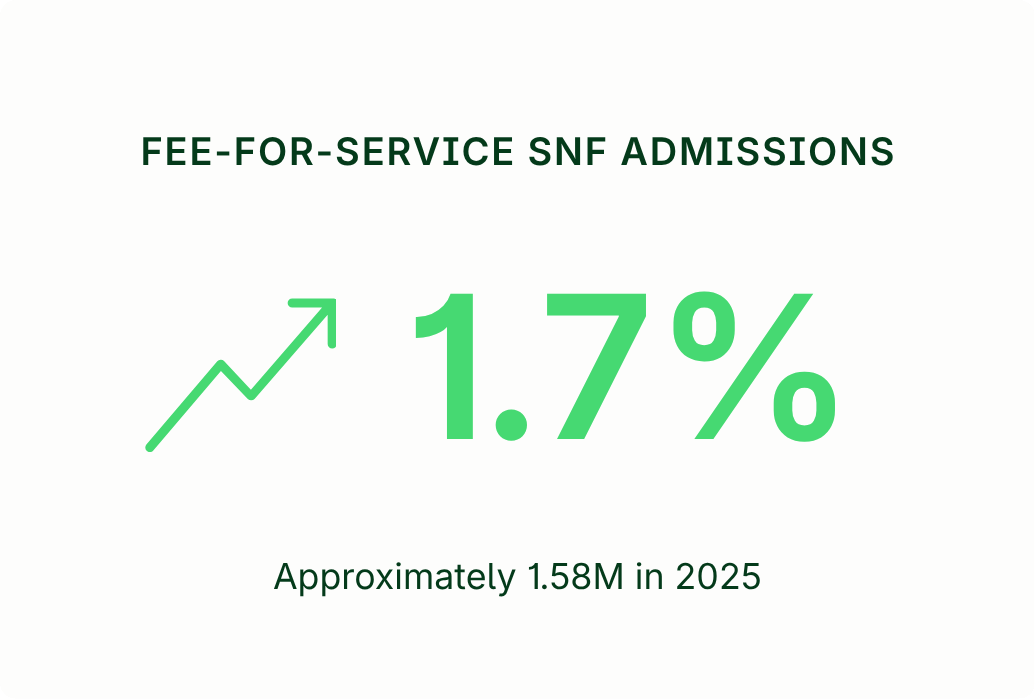
FFS skilled nursing admissions have stabilized after a hard two years: a 13.7% drop in 2023, another 5.2% in 2024, then a 1.7% recovery to 1.58M in 2025, with every quarter running above its prior-year mark. MA supplies the backdrop: its SNF admissions reached 1.48M by 2023, narrowing FFS’s lead to 158K. With MA enrollment growth now flat, 2025’s level may be the shape of the new baseline.
Skilled Nursing
Skilled Nursing Utilization by State
The average risk score of FFS skilled nursing patients has risen every year since 2020, reaching 2.85 in 2025 — the highest-acuity caseload in post-acute care. Against that backdrop, utilization eased to 22.4% while hospitalization rose to 31.0% and readmissions to 15.6%. The hospitalization increase is the map’s most striking pattern, rising across all 50 states and D.C. over two years, a breadth that points to system-wide forces — rising acuity among them — rather than local performance.
TEAM Model
Home Health and SNFs’ Role in TEAM Model Success and Care Transition Optimization
Under TEAM, the hospital is accountable for spending and outcomes across the full 30-day episode. Five surgical procedures are covered, with total episode costs from about $30K for a joint replacement to over $51K for a bypass. Where patients go after surgery is a choice, and it varies widely — some markets favor home health, others skilled nursing for the same procedure. That choice carries outcome stakes determined by patient needs and strong post-acute partnerships.
HME and Infusion
Top Home Medical Equipment & Infusion Codes by Claim Volume
The ten largest HME codes and the ten largest infusion codes tell two very different stories. In HME, respiratory rules: nine of the top ten codes are oxygen or PAP equipment and supplies, led by oxygen concentrators (E1390) at 21.7M claims. In infusion, the top ten are essentially fluids and antibiotics — four IV-fluid codes and four IV-antibiotic codes, plus two catheter supplies — led by normal saline (J7030) at 13.4M. Both are Medicare-anchored, but HME’s leaders skew toward Medicare Advantage while infusion’s pull in more commercial and Medicaid volume.
About our data sources
As an Innovator in the Centers for Medicare & Medicaid Services’ Virtual Research Data Center Program, Trella Health has access to 100% of Medicare Part A and Part B claims, as well as Medicare Advantage data. Findings in this report were derived from Medicare fee-for-service claims through Q4 2025, Medicare Advantage claims through Q4 2023, CMS Medicare Advantage Enrollment by Contract and State data, CMS Monthly Enrollment data through January 2026, and supplemental claims data.
About Trella Health
Market intelligence, referral workflows, and care coordination drive smarter decisions and healthier outcomes.
Every product shares the same data foundation. Insights feeds your CRM. Your CRM informs Strategy. Strategy to clinical workflows through Connect, Discharge, and Intake. The result: a single source of truth that eliminates silos across your entire organization.
See your market, target with precision, and grow with confidence. Trella customers grow admissions 10% faster than the national market.
Mobile-ready, insights embedded, and clinically connected. Trella CRM cuts rep calendar admin time by 47%, simplifying the physician referral relationship and targeting process.
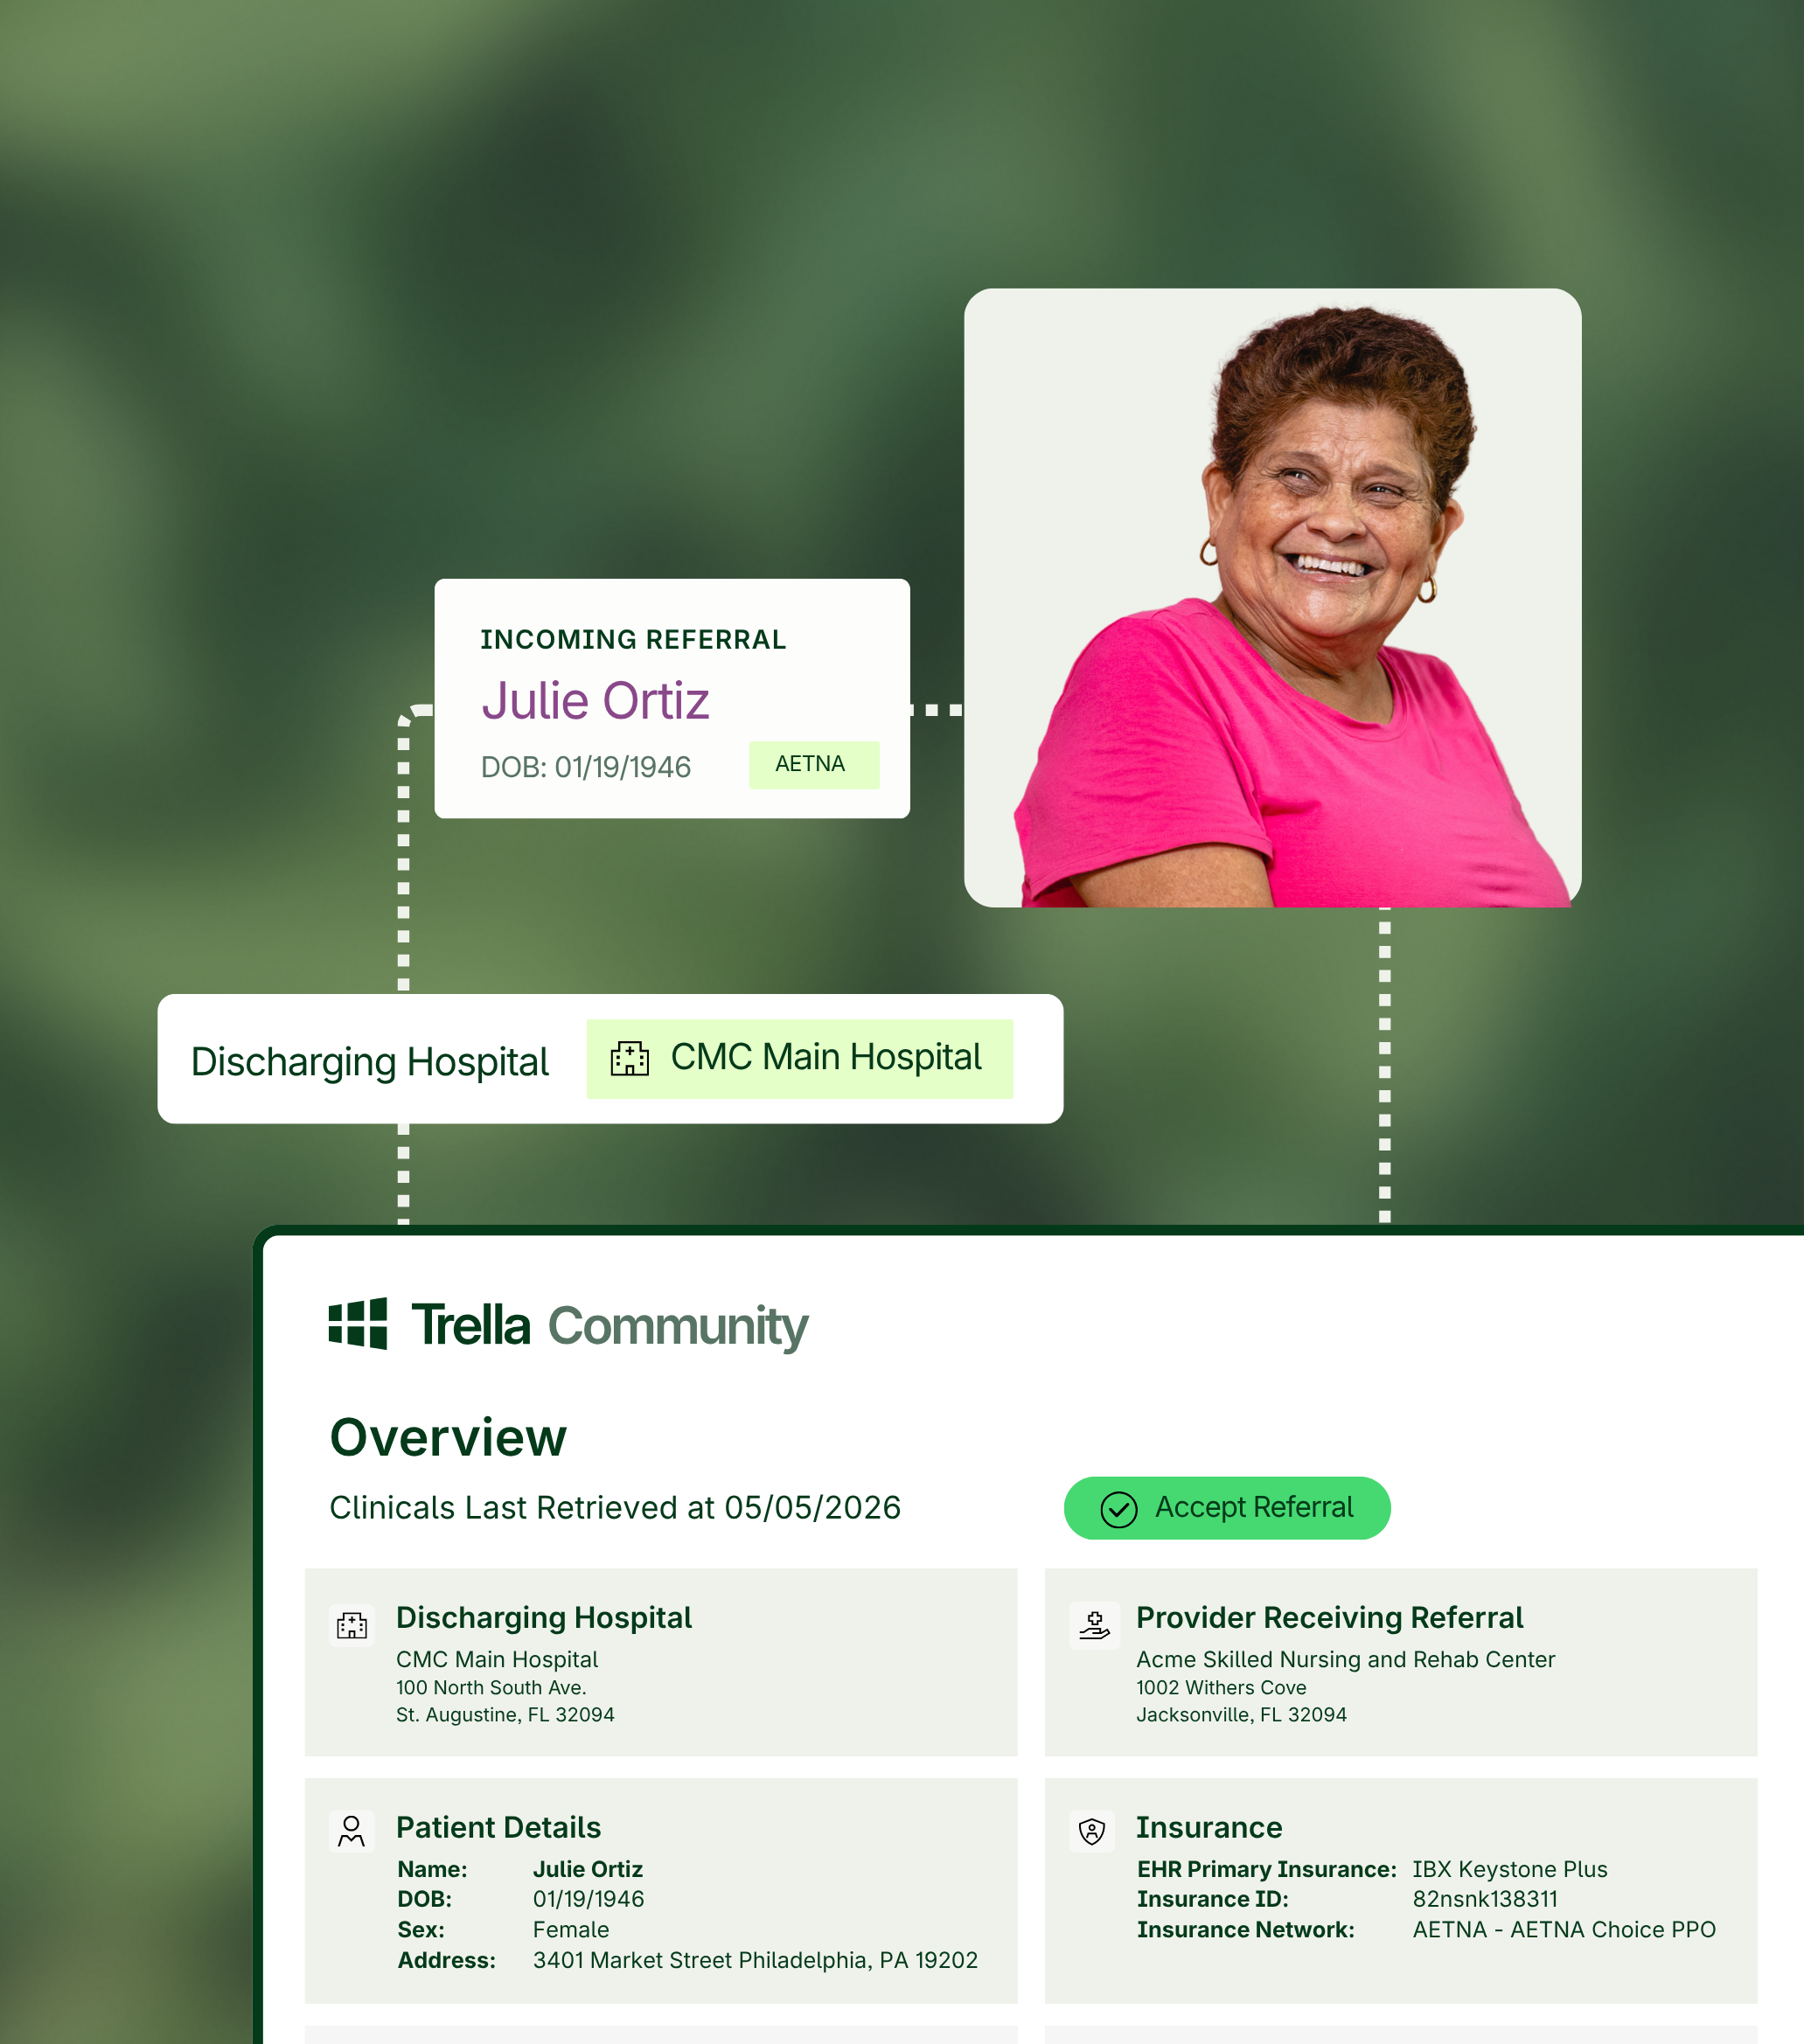
Real-time visibility. Faster referral conversions. Better-fit patients. Trella Referral Management drives an average 46.9% increase in monthly referral volume.