New This Year: Our Annual Report Goes Interactive

Post-Acute Market Intelligence Report: 2026 Edition

This year’s Post-Acute Market Intelligence Report isn’t a report you simply read. It’s one you use. Every chart is interactive. Select any state or combination of markets, toggle between metrics, and hover to see the exact figures behind every trend. From admissions and utilization to quality, cost of care, and TEAM readiness, the report provides national benchmarks and lets you drill down to the markets where you operate.

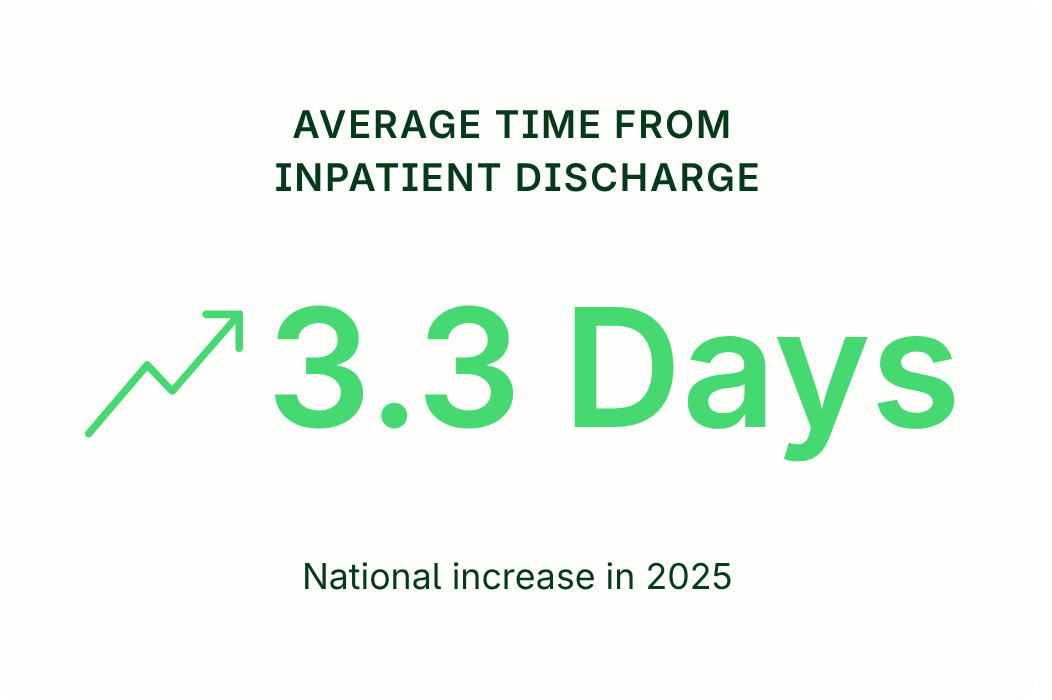
A graphic shows "Average time from inpatient discharge: 3.3 days," with an upward arrow and the note "National increase in 2025.
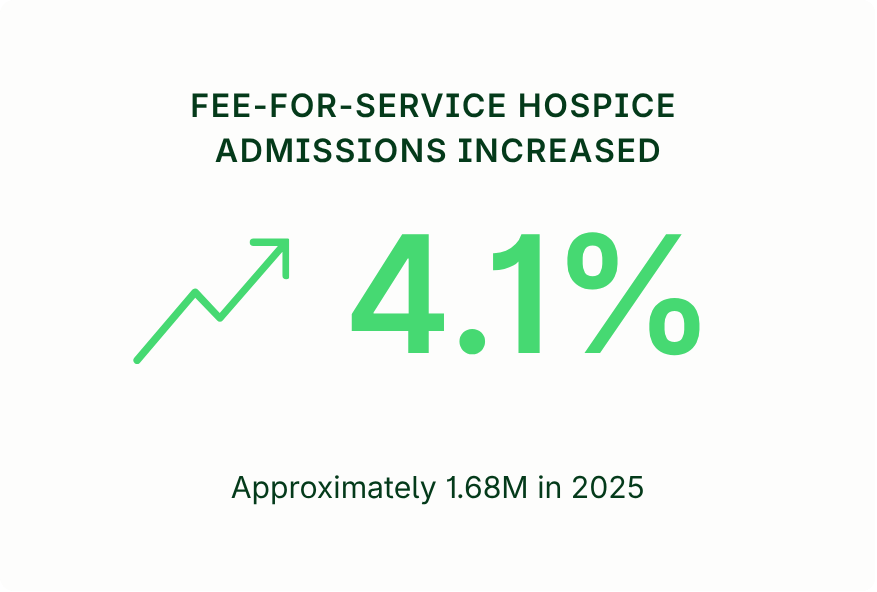
Green arrow rising next to text: "Fee-for-service hospice admissions increased 4.1%. Approximately 1.68M in 2025." White background.
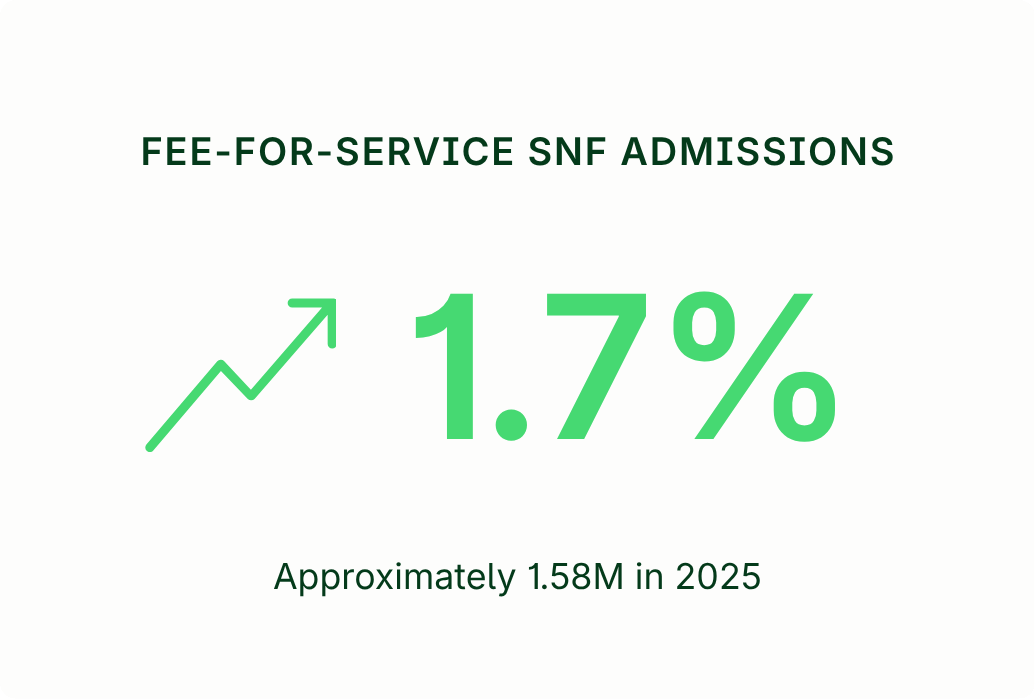
A graphic showing a 1.7% increase in fee-for-service SNF admissions, with an upward arrow and an estimate of 1.58M admissions in 2025.

Hear From Trella Health’s CEO

A note from Scott Tapp

At Trella Health, we believe better healthcare starts with informed decisions. That requires more than data alone. It requires actionable intelligence, connected workflows, and the ability to turn insight into impact. 

A middle-aged man with short hair and glasses, wearing a light beige blazer and white shirt, smiles in an office setting with blurred windows and plants in the background.
Scott Tapp
CEO

This year’s report captures a market at an inflection point. Medicare Advantage growth went flat for the first time in a decade. FFS home health and skilled nursing volumes are showing the first signs of a new baseline. Hospice continues to grow, and the report quantifies why earlier adoption matters for patients and for total cost of care. And the patients moving through post-acute care are growing more clinically complex.

These shifts are exactly why we built this report and why we keep innovating in our solutions. As Trella Health expands our AI-enabled intelligence and workflow platform, our focus remains clear: helping healthcare organizations strengthen clinical and business operations, drive high-quality care, and deliver healthier outcomes.

We hope this report serves as a valuable resource for your planning and decision-making, and for the first time, one you can explore interactively, down to the markets you serve.

Thank you for trusting Trella Health as a partner in navigating what’s next.

— Scott

Notable Insights

Key trends shaping post-acute growth and performance

A thick black rightward-pointing arrow on a white background.
Medicare Advantage growth went flat for the first time in a decade

National Medicare Advantage penetration held at 55.4% through January 2026 after increasing by an average 2.1 percentage points annually since 2017. Thirty states now have Medicare Advantage penetration above 50%, including 14 states above 60%.

Explore the Data
Black pie chart icon with a large segment separated, overlapped by a dollar sign inside a circle, on a light background.
Earlier hospice adoption is associated with lower end-of-life spending

Patients with 121 or more days on hospice averaged a $29K lower total cost of care over their final six months than patients who never enrolled — $68K versus $97K.

Explore the Data
Black outline of a stylized bird, shown in profile with a curved head, pointed beak, and simple wing and tail shapes, on a plain white background.
Hospice admissions gained momentum in 2025

Fee-for-service hospice admissions increased 4.1% in 2025, rising from approximately 1.61M to 1.68M. Hospice admissions have now increased 18.5% nationally since 2019, although admissions growth varies considerably by state.

Explore the Data
A simple black bar graph with four vertical bars of varying heights on a white background, displayed within a black-bordered chart.
Home health start-of-care performance differs widely across states

The average time from inpatient discharge to the start of home health care increased nationally to 3.3 days in 2025. Start times slowed in 39 states, with state averages ranging from 2.3 days to 6.5 days.

Explore the Data
Black zigzag arrow pointing upward and to the right on a light background, symbolizing growth, progress, or an increase.
Skilled nursing admissions returned to growth

Fee-for-service skilled nursing admissions increased 1.7% to approximately 1.58M in 2025, marking its first annual growth since 2022. However, the recovery remains uneven, with admissions increasing in 27 states and declining in 24.

Explore the Data
Black and white line drawing of two hands shaking, forming a geometric and stylized handshake symbol.
TEAM raises the stakes for post-acute referral relationships

Across the five TEAM surgical episodes, average costs range from roughly $30K for joint replacement to $51.3K for bypass, reinforcing the need for post-acute providers to demonstrate value to hospital referral partners.

Explore the Data

Medicare Advantage

National Medicare Advantage Penetration

For nearly a decade, Medicare Advantage moved one way: up and to the right. That paused this year. Through January 2026, national MA penetration held at 55.4%, flat after gaining 18.7 points since 2017. January is only the first read on the year, not the full picture, but the shift is real and worth watching. For the first time in years, Fee-for-Service grew nearly as fast as MA (+348K vs. +361K). Underneath the flat line, penetration fell in 22 states, largely where carriers exited. Vermont is the sharpest — major plans didn’t renew, and penetration collapsed from 33.5% to 13.7% in a year, sending 30,000+ beneficiaries back to Fee-for-Service.

MA penetration held at 55.4%, its first flat year in a decade

After averaging +2.1 points a year since 2017, national Medicare Advantage (MA) penetration didn’t move from 2025 to January 2026.

Total Medicare eligibility grew +710K, but split evenly

The Medicare-eligible population added about 710K beneficiaries from 2025 to Jan 2026, but for the first time in years the gain divided almost evenly: MA +361K, FFS +348K.

14 states now top 60% MA penetration

MA exceeds 50% in 30 states and 60% in 14, including Michigan, Alabama, Ohio, Florida, and North Carolina.

Medicare Advantage

Medicare Advantage Penetration by State

Medicare Advantage penetration is higher than in 2017 across 49 states, but the map is anything but uniform. Penetration spans a 64-point gap, from Michigan’s 67.4% to Alaska’s 3.1%, shaped by decades of plan availability, regional preference, and network economics. Thirty states now sit above 50% and 14 above 60%, while a handful of rural, low-density markets remain firmly Fee-for-Service.

30 states surpassed 50% MA penetration — 14 now top 60%

Thirty states exceed 50% MA penetration and 14 exceed 60%, led by Michigan (67.4%), Rhode Island (66.3%), and Alabama (66.2%), reflecting widespread saturation across diverse regions.

5 states have gained 28+ percentage points since 2017

Maine (+32.3), Connecticut (+30.5), Mississippi (+30.0), West Virginia (+29.6), and Kentucky (+28.7) led the nation, several moving from FFS-dominant to MA-majority in under a decade.

MA penetration ranges 64 points across states

From Michigan’s 67.4% to Alaska’s 3.1%, state-level penetration spans more than 64 percentage points. A handful of very-low states (AK, VT, WY) drag the national average down, but in most markets MA is the clear majority.

Medicare Advantage

Medicare Advantage Post-Acute Care Reach by Payer

The ten largest Medicare Advantage payers control 81% of national MA enrollment, and with it, an outsized share of post-acute referrals. This view compares each payer’s share of home health and SNF patients against its share of MA enrollment, exposing where a plan’s post-acute footprint runs ahead of or behind its enrollment. This gap elucidates which payers post-acute agencies should prioritize contracting not just based on their enrollment, but how these plans incentivize the usage of home health and SNF services. Figures reflect 2023, the latest year with payer-level utilization data.

The two largest payers control 45% of MA enrollment

UnitedHealth (25.3%) and Humana (19.7%) together held 45% of national MA enrollment in 2023, illustrating how significant these payers are in the national market and why it’s essential for PAC agencies to work closely with them.

UnitedHealth and Humana use home health and SNF services more than their enrollment alone suggests

UnitedHealth and Humana combined amounted to 45% of enrollment but accounted for a higher proportion of home health patients (47.4%) and SNF patients (49.9%). This indicates these payers may have plan models that utilize home health and SNF services more than others — a key variable in building strong relationships with PAC partners.

Kaiser's SNF share sits below its enrollment share (−2.8 pp) — a care model difference, not a scale one

Kaiser accounted for 6.6% of MA enrollment but 3.8% of skilled nursing patients, the largest negative difference among the ten largest payers.

Post-Acute Discharge

Inpatient Discharges by Post-Acute Care Instruction

How inpatient discharge instructions split across care settings shapes the entire downstream post-acute market. That split has been quietly reweighting: home health rose to 22.6% of FFS inpatient discharge instructions in 2025 while skilled nursing slipped to 20.0%, reversing their 2019 order and making home health the leading directed post-acute destination. This chart breaks annual discharge instructions into all six destinations, nationally and for every state, from 2019 through 2025.

Home health gained share in inpatient discharge instructions, while SNF has slipped

Home health rose from 20.7% of inpatient discharge instructions in 2019 to 22.6% in 2025, overtaking skilled nursing instructions (21.3% → 20.0%). The reversal landed in 2020, as COVID-19 pushed patients away from SNF settings and toward care at home.

State discharge patterns range 4-to-1 on home health

Home health’s share of instructions runs from 32.0% in Massachusetts down to 8.6% in Montana — nearly a fourfold gap. New England (MA, RI, CT) leans heaviest on home health; the Mountain West and Plains (MT, WY, SD) least.

Where you live shapes what happens after the hospital

Only 36% of patients in Connecticut are discharged with no post-acute instruction, compared to 73% in Alaska. Provider access and local practice patterns drive a gap that may have little to do with patients’ actual needs.

Post-Acute Discharge

PAC Instructional and Adherence Variation by State

Two metrics have a strong influence on whether a hospital discharge becomes a post-acute admission: how often patients are instructed to PAC, 53.0% of FFS discharges in 2025, and how often they follow that instruction. Adherence to inpatient discharge instructions ranges from 90.5% for hospice down to 70.7% for home health. The state maps sharpen the picture: instruction rates span 27.5% to 64.4%, and even hospice adherence — the most reliable in the country — falls to 78.6% in New York.

53.0% of discharges carry a PAC instruction, leveling after consistent increases

Up just 0.1 points in 2025 after +0.8 the year before. Nearly half of FFS inpatient discharges still leave the hospital with no post-acute plan at all.

SNF adherence has fallen two straight reporting periods (85.6% → 83.7%)

Paired with SNF’s shrinking share of discharge instructions, the skilled nursing funnel is narrowing at both stages.

Hospice adherence remains above 90% nationally, with significant state variation

New York ranks last among the 50 states and D.C., at 78.6%, 11.9 percentage points below the national average, while more than 45 state-level markets exceed 85%.

Post-Acute Discharge

Average Time to Start of Home Health Care after Inpatient Discharge by State

Time to start care is the metric referral sources actually feel. In 2025, the national average rose to 3.3 days, with start times worsening in 39 states. The spread is nearly threefold: Louisiana starts care in 2.3 days, Hawaii in 6.5 days.

National average time to start of care increased by 0.2 days to 3.3 in 2025

The 0.2-day increase in 2025 snapped a two-year run of flat national performance, and it wasn’t driven by outliers. From the Gulf South to the Pacific Northwest, most states gave back ground.

In 39 states, home health starts slowed in 2025

When three-quarters of the country moves in the same direction in the same year, the cause isn’t local. Louisiana, with the nation’s shortest time to start of care, and Alaska, among the longest, both added time in 2025.

In just 14 states, the average home health start comes within 3 days

Louisiana (2.3 days) and Utah (2.4) set the pace among the 14 states starting care inside 3 days. In the other 37, the first visit stretches past three days — and in the slowest six days.

Home Health

Home Health Admissions by Quarter

FFS home health admissions continued to decline amid the ongoing shift toward MA, illustrated by the annual FFS and MA totals beneath the chart. Plateauing MA enrollment could foreshadow a new benchmark for expected FFS home health admissions in the near future.

Home health demand is growing, just not in FFS

Combined FFS and MA admissions rose from 6.65M to 7.09M between 2019 and 2023, growth of 6.5% while FFS shrank 19%. The volume didn’t disappear. It moved to Medicare Advantage.

The lowest quarter in the series isn't the pandemic. It's Q4 2024

FFS home health admissions recovered from the temporary decreases amidst the pandemic but continued to decrease due to the shift towards more MA enrollment.

For the first time in the series, every 2025 quarter is up year-over-year

Quarterly volumes kept easing lower for two more years — until 2025, when all three reported quarters came in above the prior year for the first time in the series.

Home Health

Home Health Utilization, Hospitalization, and Readmissions

The average risk score of FFS home health patients has risen every year since 2020 — from 2.31 to 2.56, and up 7.2% since 2019. Over the same stretch, home health has been the leading post-acute destination, with 22.6% of FFS discharge instructions in 2025. Hospitalization rose for a third straight year (24.2%) and readmissions ticked up to 12.0% — but read those rates against the acuity climb. More complex patients are arriving in higher volume.

Home health FFS utilization is steady at 24.5% nationally — but ranges from 11.9% to 35.4% by state

Massachusetts leads the nation at 35.4%, with Rhode Island and New Hampshire close behind, while the northern Plains (Montana 11.9%, North Dakota 12.6%) sit at a third of those rates.

49 states saw FFS hospitalization rise over two years, reaching 24.2% nationally

A move that broad isn’t 49 states underperforming at once. It’s the national acuity climb showing up everywhere, as agencies take on patients who once went to facility care.

FFS readmissions ticked up to 12.0%, with the increase spread across 36 states

The climb from 11.8% moved through 36 states — modest, broad, and consistent with a caseload at its highest average risk score in the data.

Hospice

Hospice Admissions by Quarter

FFS hospice admissions reached 1.68M in 2025, up 4.1%, the fastest annual growth in five years, and the fourth consecutive year the growth rate has accelerated. Unlike home health and skilled nursing, where FFS volume has compressed as enrollment shifts to Medicare Advantage, hospice remains a fee-for-service benefit for nearly all Medicare patients.

FFS hospice admissions grew 4.1% in 2025, the fastest rate in five years

1.61M to 1.68M, and the fourth straight year the growth rate has increased: +1.1% in 2022, +2.2% in 2023, +3.7% in 2024, +4.1% in 2025.

The national +18.5% growth since 2019 masks wide state variation

Admissions range from +47% in Alaska to −4% in New York, the only state below its 2019 level. Use the market selector below to view growth in the markets you serve.

Q1 2025 set a new high: 441.1K admissions in a single quarter

Q1 is reliably hospice’s strongest quarter, and each year’s Q1 has topped the last since 2023, useful for quarter-over-quarter benchmarking.

Hospice

Hospice Utilization and Average Length of Stay by State

Hospice utilization is rising at roughly a point a year — 51.9% of FFS decedents in 2025, with gains in 50 states over two years. Average length of stay is also increasing, up two days since 2023 to 66.5 days. Longer stays often reflect earlier hospice identification and are associated with lower total cost of care, as quantified in the next section.

Hospice deaths rose 4.1% vs. a 1.8% rise in total Medicare mortalities

The gap between the two growth rates is what drives utilization upward — hospice deaths grew from 1.26M to 1.31M between 2024 and 2025, growing at more than twice the rate of overall Medicare mortalities.

The highest- and lowest-utilization states diverge on length of stay

Utah leads the nation at 67.6% utilization with 76.2-day average stays; New York sits last at 27.5%, among the shortest stays — adoption and early identification moving together.

ALOS has climbed YoY: 64.5 days in 2023, 65.7 in 2024, 66.5 in 2025

A two-day increase over two consecutive years suggests that earlier hospice identification is rising alongside utilization. When admissions and length of stay increase together, it may indicate that more patients are reaching hospice and receiving care earlier in their end-of-life journey.

Hospice

Cost of Care by Hospice Adoption Timeframe

Patients who enter hospice earlier accrue markedly lower total end-of-life Medicare costs: $68K over the final six months for 2025 decedents with 121+ days on hospice, versus $97K for those who never enrolled. As hospice tenure grows, hospice spending rises — but inpatient spending falls much faster, so the total drops sharply. This is an association, not a controlled effect — earlier-hospice patients differ clinically from those who never enroll — but the pattern underscores the value of early identification for hospices competing in value-based care networks.

Patients with 121+ days on hospice averaged a $29K lower cost of care

$68K versus $97K for those who never enrolled, all 2025 decedents, a 30% difference in total Medicare spend over the final six months of life.

Even two weeks or less on hospice is associated with $7K lower spend

Patients with 0–14 days of hospice averaged $90K in Medicare spending, compared with $97K for those with no hospice. The difference appears even at the earliest adoption window, not only among patients with longer stays.

The cost difference holds across all 50 states and D.C., with no exceptions

The gap between never-enrolled and 121+ day patients ranges from $1.7K in Nevada to $43.5K in Maryland, but every state runs the same direction.

Skilled Nursing

Skilled Nursing Admissions by Quarter

FFS skilled nursing admissions have stabilized after a hard two years: a 13.7% drop in 2023, another 5.2% in 2024, then a 1.7% recovery to 1.58M in 2025, with every quarter running above its prior-year mark. MA supplies the backdrop: its SNF admissions reached 1.48M by 2023, narrowing FFS’s lead to 158K. With MA enrollment growth now flat, 2025’s level may be the shape of the new baseline.

2025 was the first growth year since 2022: admissions rose 1.7% to 1.58M

All four quarters ran above their 2024 counterparts — strongest in Q1 (+4.1%) and holding positive through Q4.

10.1% MA SNF admission growth surpassed MA enrollment rise

Between 2022 and 2023, MA skilled nursing admissions rose 10.1%, exceeding the 7.9% growth in MA enrollment — members are using SNF at a rising rate, not just growing in number.

The 2025 turn split the country: 27 states grew, 24 kept declining

California’s +10.1% and other large-state gains carried the national +1.7% — use the market selector below to see which side of the line your markets landed on.

Skilled Nursing

Skilled Nursing Utilization by State

The average risk score of FFS skilled nursing patients has risen every year since 2020, reaching 2.85 in 2025 — the highest-acuity caseload in post-acute care. Against that backdrop, utilization eased to 22.4% while hospitalization rose to 31.0% and readmissions to 15.6%. The hospitalization increase is the map’s most striking pattern, rising across all 50 states and D.C. over two years, a breadth that points to system-wide forces — rising acuity among them — rather than local performance.

FFS SNF utilization is steady at 22.4%, but varies fourfold by state

The Northeast leans on facility care most — Connecticut, New Jersey, and New York all above 26% — while Alaska’s 8.0% runs at a third of the national average.

SNF hospitalization reached 31.0% in 2025, up 3.5 points in two years

23 states reported rates of 30% or higher in 2025, up from 4 in 2023. With rates rising in all states and D.C., the pattern points to system-wide drivers — including a caseload whose average risk score has climbed every year since 2020.

SNF readmissions rose modestly to 15.6%, up every year since 2019

Rates increased in 41 states, with the range spanning Alaska’s 9.5% to Illinois’s 17.4% — a nearly 8-point spread in the metric hospital partners watch most closely.

TEAM Model

Home Health and SNFs’ Role in TEAM Model Success and Care Transition Optimization

Under TEAM, the hospital is accountable for spending and outcomes across the full 30-day episode. Five surgical procedures are covered, with total episode costs from about $30K for a joint replacement to over $51K for a bypass. Where patients go after surgery is a choice, and it varies widely — some markets favor home health, others skilled nursing for the same procedure. That choice carries outcome stakes determined by patient needs and strong post-acute partnerships.

Each of the five TEAM procedures has its own discharge pattern

Hip and femur fracture is the only SNF-led episode (42.7%); CABG sends 43.8% of patients to home health; 53.7% of major bowel patients leave with no PAC instruction at all.

Joint replacement is TEAM's volume anchor — and its most balanced episode

The only procedure where home health (38.7%) and skilled nursing (31.4%) both carry substantial share, making it the episode where discharge patterns have the most room to shift.

CABG carries the most exposure: the costliest episode and the widest readmission gap

At $51.3K per episode and a 10.5-point spread between home health (8.0%) and skilled nursing (18.5%), CABG puts more risk on the discharge decision than any other episode.

HME and Infusion

Top Home Medical Equipment & Infusion Codes by Claim Volume

The ten largest HME codes and the ten largest infusion codes tell two very different stories. In HME, respiratory rules: nine of the top ten codes are oxygen or PAP equipment and supplies, led by oxygen concentrators (E1390) at 21.7M claims. In infusion, the top ten are essentially fluids and antibiotics — four IV-fluid codes and four IV-antibiotic codes, plus two catheter supplies — led by normal saline (J7030) at 13.4M. Both are Medicare-anchored, but HME’s leaders skew toward Medicare Advantage while infusion’s pull in more commercial and Medicaid volume.

The top HME codes are a respiratory story

Nine of the ten highest-volume HME codes are oxygen or PAP (CPAP/BiPAP) equipment and supplies. Oxygen concentrators, CPAP devices, and PAP filters lead the group, and continuous glucose monitoring is the only non-respiratory code to crack the list.

Infusion claim leaders are fluids and antibiotics

Eight of the ten largest infusion codes by claim volume are IV fluids or IV antibiotics. The remaining two are catheter-flush supplies — heparin flush and sterile water/saline.

Both are Medicare-anchored, but the payer mix diverges

Among the top ten HME codes, Medicare and Medicare Advantage together make up roughly 69% of claims. The top ten infusion codes lean less on Medicare and more on commercial and Medicaid — consistent with a younger, working-age infusion population.

Voices of Experience

Post-Acute Care Leaders on Trends, Challenges, and Opportunities

“The number one priority is implementing business practices that incorporate AI but don’t eliminate the human tribal knowledge that’s so important to the relationships we have with our referral partners.”

Woman with wavy blonde hair, wearing glasses, a white blouse, and a black blazer, smiling and facing the camera against a plain light background.
Maura Flanary
Vice President of Network Services, Prism Healthcare

“Growth success is no longer measured solely by the volume of referrals or new patients. Instead, we are pivoting toward a “smart growth” approach prioritizing quality, sustainability, and financial performance over sheer volume.”

Man in a blue suit jacket and light blue shirt, smiling, against a dark plain background.
Noah Franz
VP of Customer Service, CarepathRx

“We’re in the early stages of AI adoption at the health-system level, using it more for analysis and administrative support. It’s time to shift AI to the bedside for care efficiency—and more specifically, documentation efficiency. Think talk-to-text on steroids, with ambient listening. The main challenge is competing priorities within a larger organization.”

Smiling man with short hair and beard, wearing a checked dress shirt and dark blazer, posing for a professional headshot against a plain gray background.
Brad Parrish
COO, HCA Healthcare

“Reimbursement pressures will always be in play, and have been consistently for the last 30 years. It seems every year that efficiency, productivity, and retention are front and center on the improvement plan. It costs us too much to recruit and train clinicians, and if we don’t make it ‘easy’ for them to see patients and document fully and on time, they won’t stick around in this space. We MUST make it easier to provide clinical care and be more efficient while still complying with rules and regulations—perhaps this is where automation and AI can help.”

Man with short hair and beard wearing a checked shirt and dark blazer, smiling at the camera against a plain background.
Brad Parrish
COO, HCA Healthcare

“We’re still in the ‘do both’ model — we have to keep performing in the model we have today while we prepare for the model we’ll have tomorrow. The winners will be the ones who can simultaneously deliver outcomes, navigate complexity, and prove measurable value across the continuum.”

Man with dark hair and beard in a black suit and white shirt, smiling and posing in front of a stone wall background.
Chris Morrisette
Chief Strategy and Innovation Officer, Alivia Care

About our data sources

As an Innovator in the Centers for Medicare & Medicaid Services’ Virtual Research Data Center Program, Trella Health has access to 100% of Medicare Part A and Part B claims, as well as Medicare Advantage data. Findings in this report were derived from Medicare fee-for-service claims through Q4 2025, Medicare Advantage claims through Q4 2023, CMS Medicare Advantage Enrollment by Contract and State data, CMS Monthly Enrollment data through January 2026, and supplemental claims data.

About Trella Health

Market intelligence, referral workflows, and care coordination drive smarter decisions and healthier outcomes.

Every product shares the same data foundation. Insights feeds your CRM. Your CRM informs Strategy. Strategy to clinical workflows through Connect, Discharge, and Intake. The result: a single source of truth that eliminates silos across your entire organization.

See your market, target with precision, and grow with confidence. Trella customers grow admissions 10% faster than the national market.

Learn More
A dashboard shows home health care performance data. An older woman is pictured above a 3.9% 30-day readmission rate for Lakeshore Senior Care, which is below the state average.

Mobile-ready, insights embedded, and clinically connected. Trella CRM cuts rep calendar admin time by 47%, simplifying the physician referral relationship and targeting process.

Learn More
A man smiles while using his phone. Next to him, CRM software data shows home health agency stats, a +14.17% patient utilization rate, and a calendar of scheduled meetings.

Real-time visibility. Faster referral conversions. Better-fit patients. Trella Referral Management drives an average 46.9% increase in monthly referral volume.

Learn More
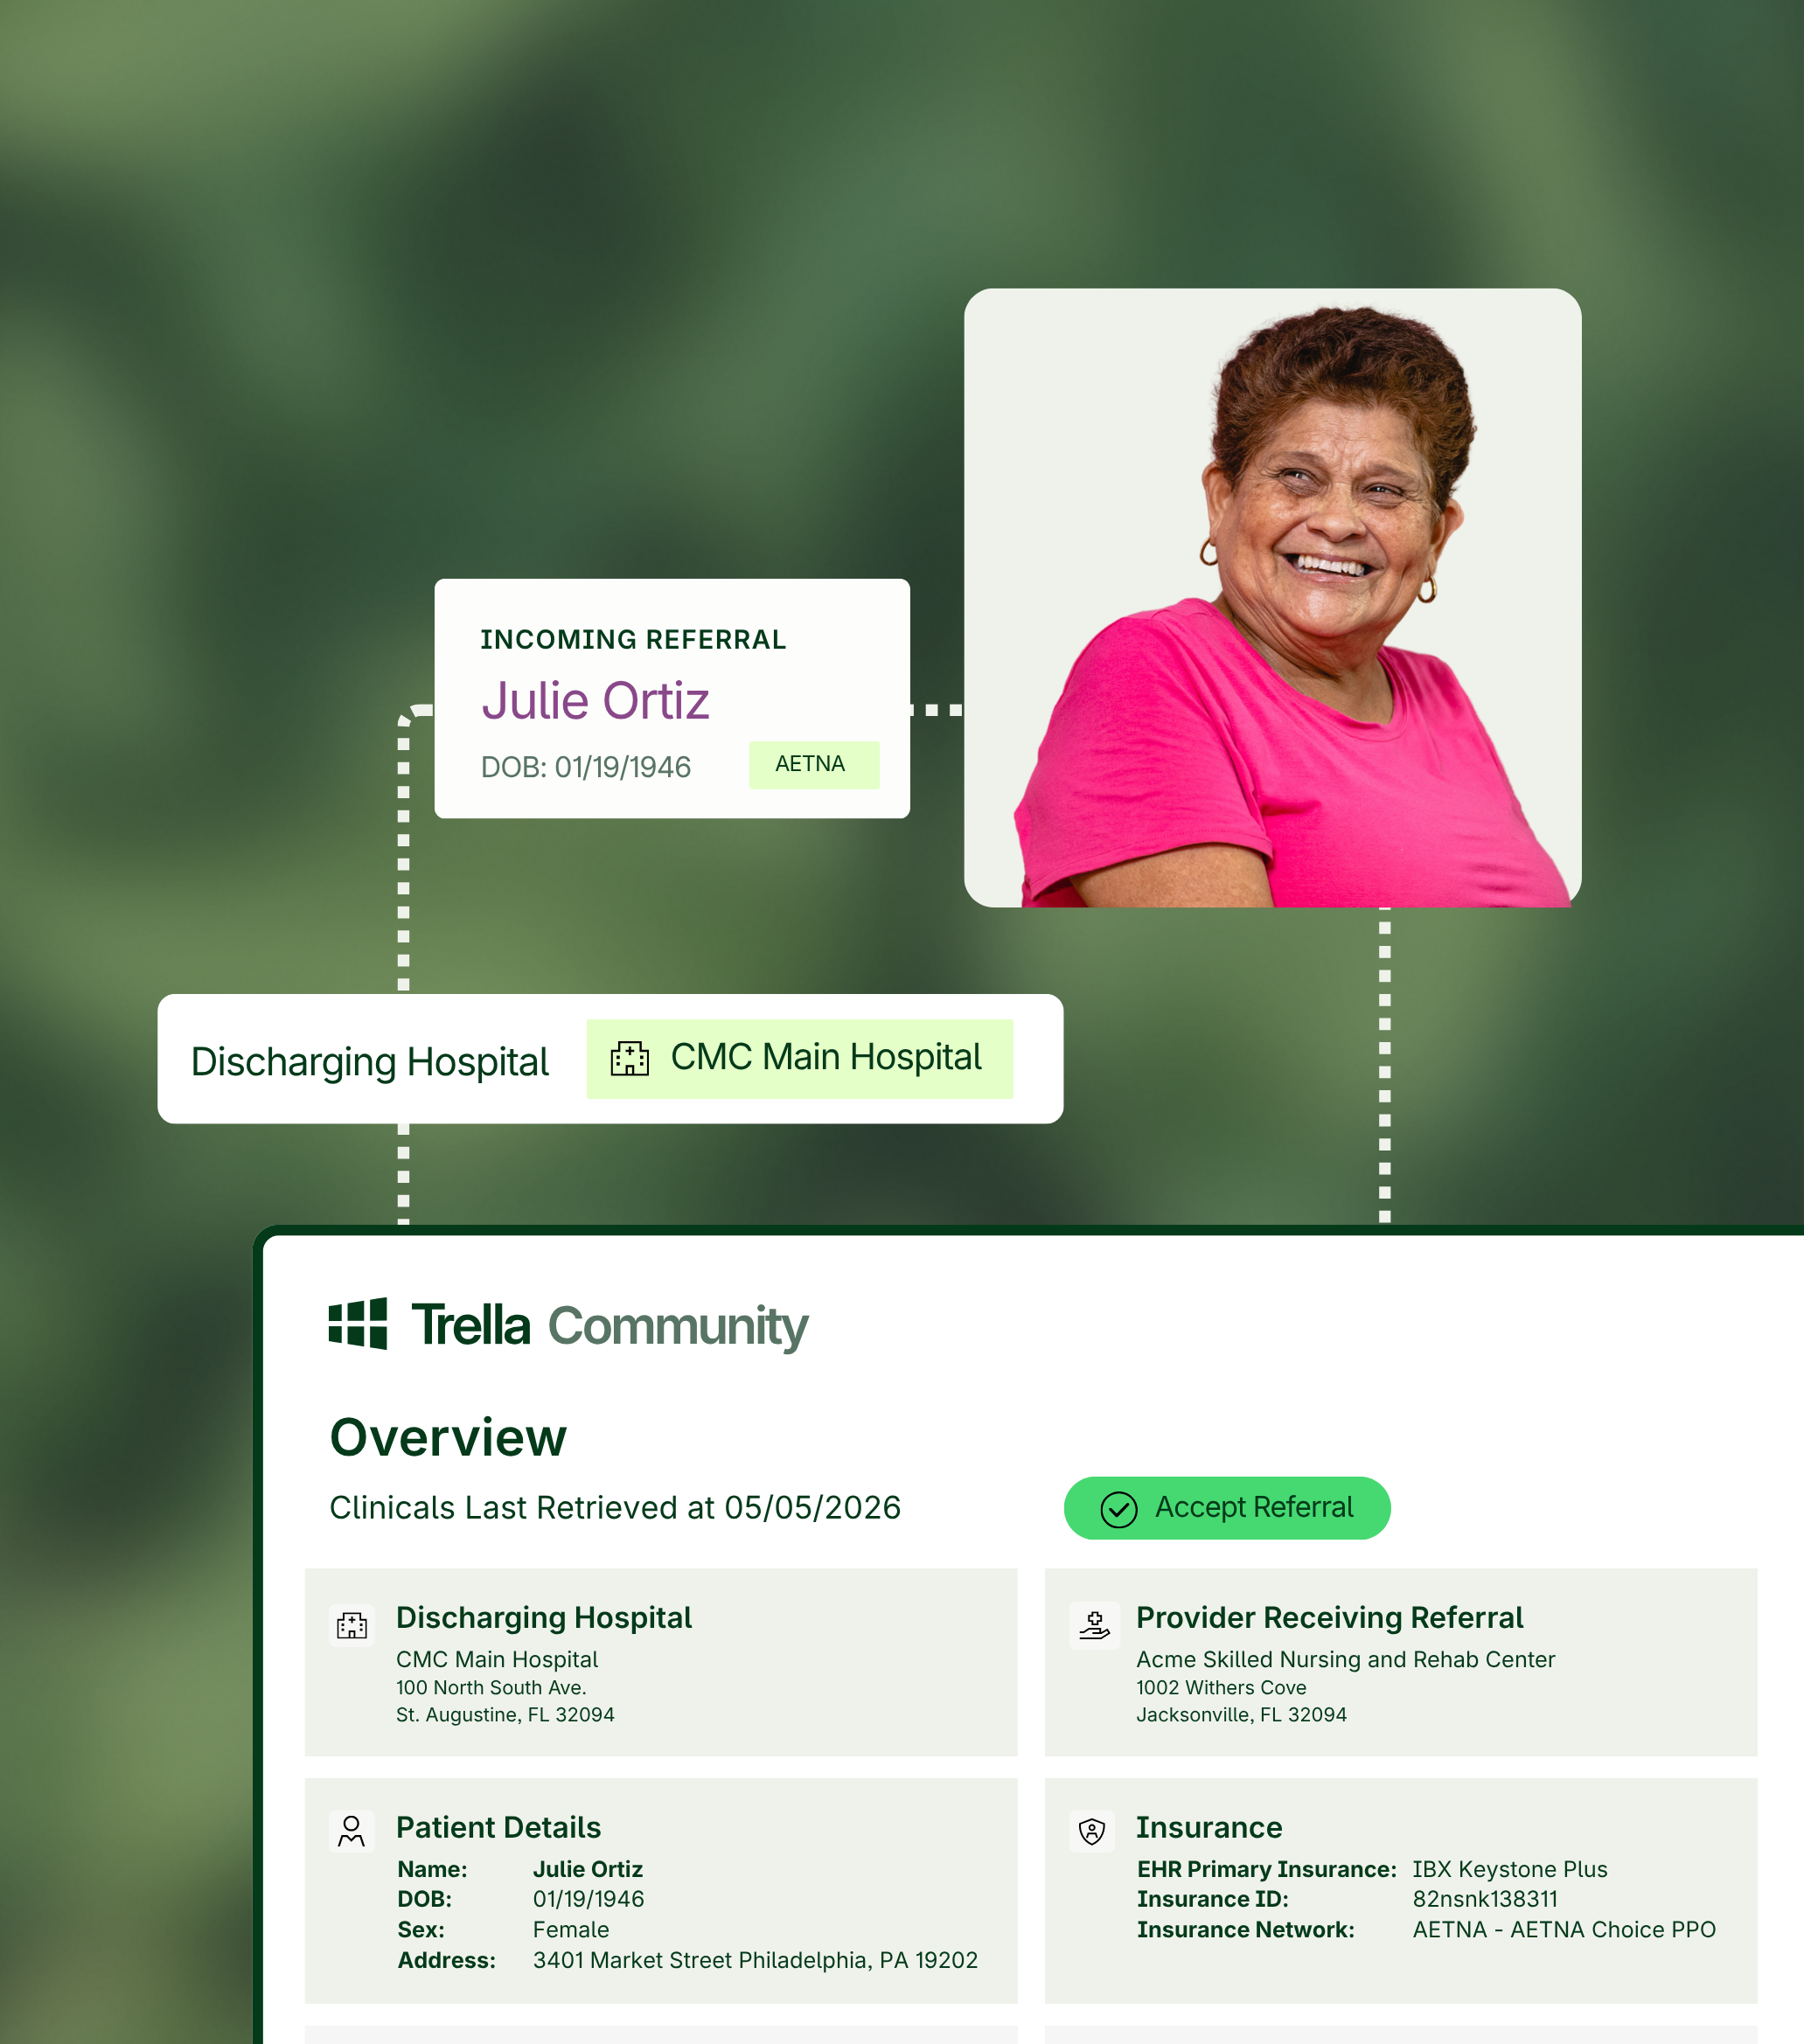
A smiling older woman is shown above a referral management dashboard displaying her medical referral details between two hospitals.