
Whitepaper

Winning Under TEAM: A Data-Driven Blueprint for Care Transition Excellence

724 hospitals are now financially accountable for the 30 days after a patient leaves the operating room — 874,000 episodes a year, 11% of all Medicare FFS inpatient volume. Nationally, nearly four in ten inpatient discharges are instructed to enter post-acute care. And the claims data says the difference between beating a target price and missing it isn’t how sick the patient was. It’s how well the handoff was executed.

  • 39.2% Share of Medicare FFS inpatient discharges instructed to enter post-acute care
  • 94.1% U.S. counties where the number of home health agencies serving FFS patients declined or held flat, 2019–2023


Download the full whitepaper.

Get the Full Whitepaper
Fill out the form below to download the PDF.

The Problem

Under TEAM, execution is the variable — not acuity

TEAM measures total episode cost against a target price, plus quality outcomes including avoidable readmissions and ED utilization, for 30 days after discharge. Analysis of 100% of Medicare FFS claims through 2025 Q2 points to one consistent finding across all five covered episode categories: performance variation is driven by the operational execution of care transitions, not by clinical complexity.

  • Fragmented referral workflows, limited post-acute visibility, and delayed placements are the primary sources of avoidable cost and readmission exposure — the controllable half of TEAM performance.
  • Post-acute adherence correlates inversely with length of stay in every TEAM category — as strong as −0.63 in CABG and −0.47 in lower extremity joint replacement. Hospitals whose patients actually begin post-acute care as planned have shorter inpatient stays.
  • Capacity is contracting while accountability expands. Home health visits per patient day fell 17.3% between 2017 and 2023, and FFS home health admissions declined in 83.3% of U.S. counties. Hospitals can no longer rely on available capacity at the moment of discharge.
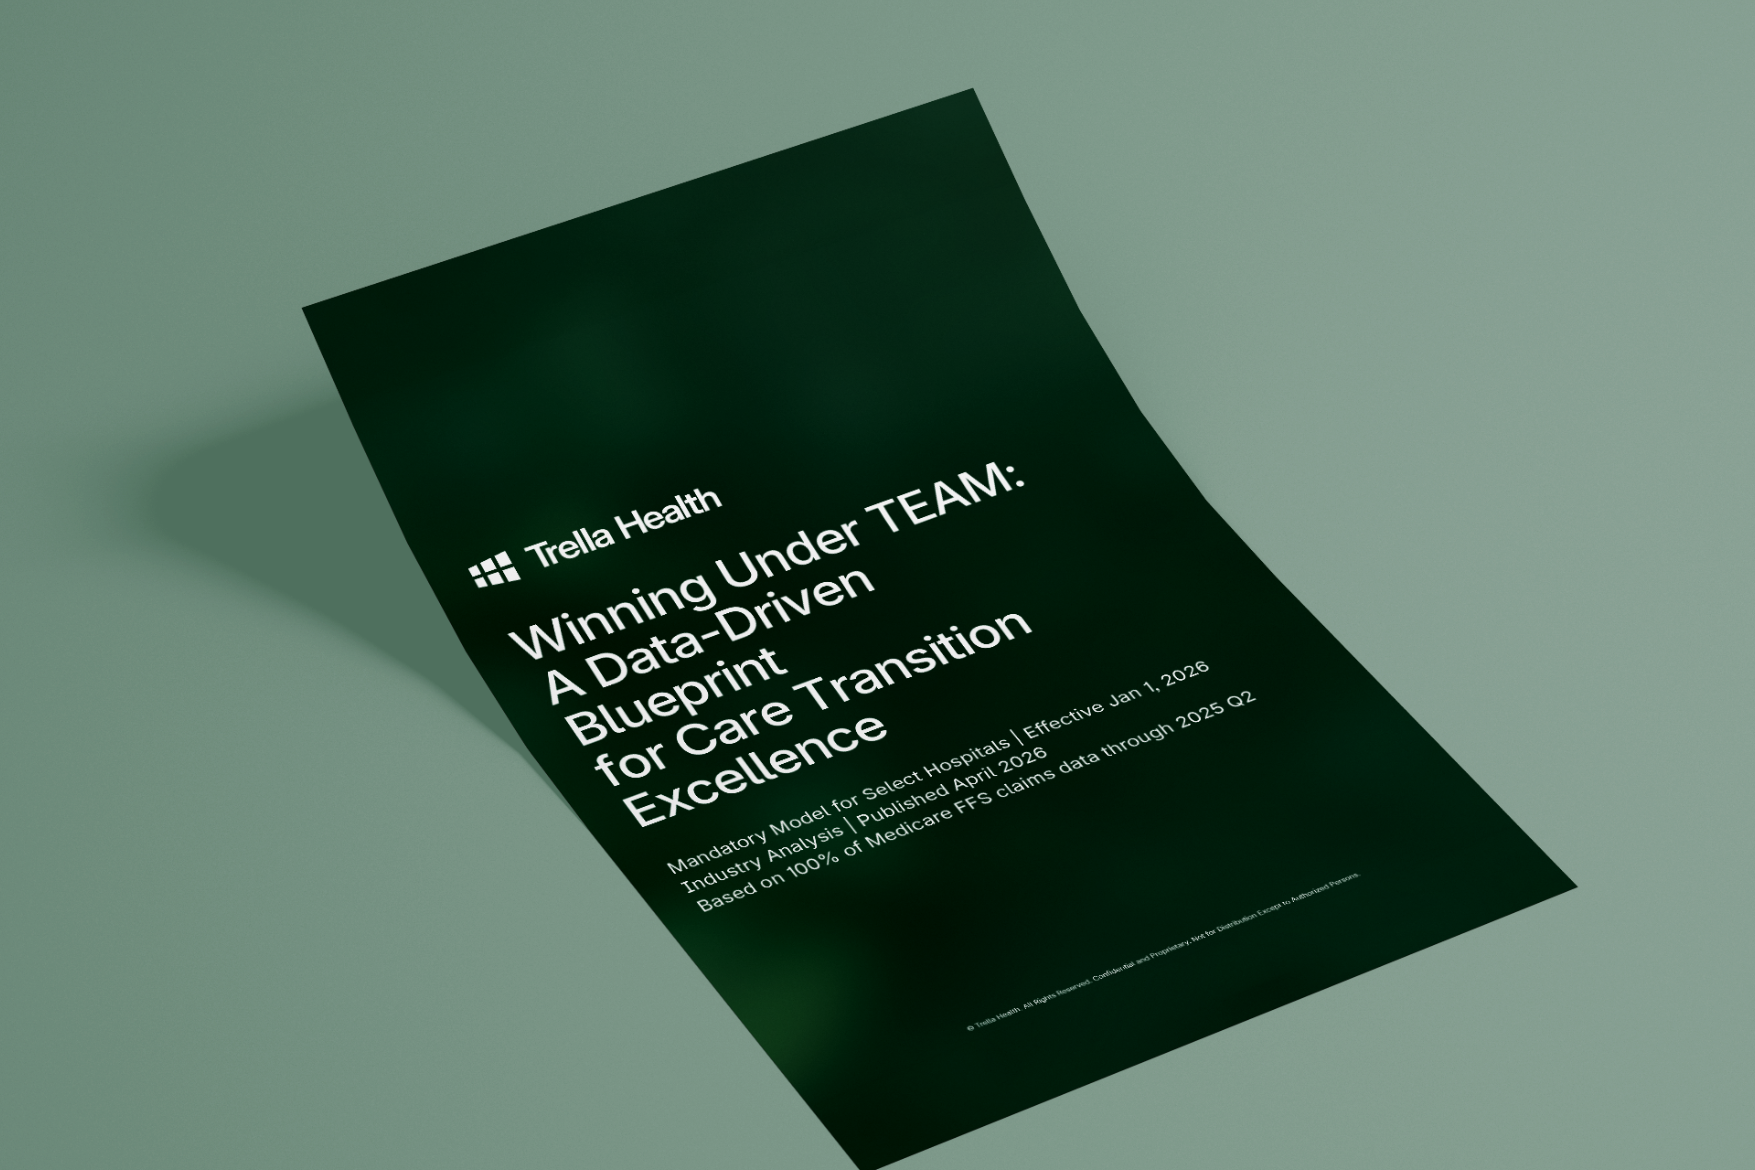
A green pamphlet tilted on a surface displays the title “Winning Under TEAM: A Data-Driven Blueprint for Care Transition Excellence” with Triella Health’s logo and additional details in white text.

The whitepaper covers:

What TEAM actually holds you accountable for

The five covered episode categories — LEJR, surgical hip and femur fracture, spinal fusion, CABG, and major bowel procedures — how total episode cost is measured against a target price, the quality measures that ride alongside it, and the 3-day SNF stay waiver most hospitals have not yet put to deliberate use.

Where the leverage sits, episode by episode

National average length of stay and 30-day readmission benchmarks for all five categories, plus correlation analysis identifying the primary transition lever in each — from home health referral timing in LEJR to SNF placement accuracy in CABG to real-time capacity visibility in hip and femur fracture.

The clinical capability gap CMS star ratings don't close

Why facility-level performance data on the post-acute providers in your market matters more than a star rating once you own the episode for 30 days — and how to evaluate partners on the outcomes you’re being measured on.

The TEAM Readiness Framework

Four levels of maturity — visibility, standardization, coordination, and optimization — with the specific capabilities that define each, so leaders can locate where their organization actually sits and what the next level requires.

Where AI-enabled intelligence becomes decisive action.

From market intelligence and CRM to care transition automation, Trella connects intelligence and workflows to improve business and clinical outcomes.