
Trella Health Resources
Explore expert insights, market-leading reports, and practical strategies powered by the healthcare intelligence trusted by leading organizations across the care continuum — helping teams make smarter decisions and drive healthier outcomes.


Blog
One Provider, Many Scorecards: Operating in a Payer-Specific VBC World
Value-based care entered post-acute care as a broad strategic concept. It is now operationalized as a fragmented reality. A home health agency, hospice provider, skilled nursing facility, or other post-acute organization may participate in multiple relationships with Medicare Advantage plans, ACO partners, commercial payers, and health system networks. Each relationship can carry different performance expectations, performance metrics, reporting cadences, and definitions of value. CMS has acknowledged that providers often report different […]
Read More 
Blog
The Move to Mandatory Episodes: What CMS’s FY 2027 inpatient rule signals for…
On Friday, July 31, 2026, CMS finalized its FY 2027 inpatient hospital payment rule. Buried in the usual mix of rate updates and quality-program tweaks is a policy that deserves the industry’s full attention: CJR-X, a nationwide, mandatory, episode-based payment model for joint replacements. Taken together with the rule’s other provisions, it suggests that episode-based accountability continues to move from selected markets toward broader mandatory participation and that […]
Read More 
Press Release
Trella Health Releases 2026 Post-Acute Market Intelligence Report — Now Fully Interactive…
Annual report captures post-acute care at a turning point: Medicare Advantage growth plateaus, FFS volumes show signs of a new baseline, and hospice growth accelerates — with every trend now explorable down to the state level. ATLANTA — July 30, 2026 — Trella Health today released its Post-Acute Market Intelligence Report: 2026 Edition. For the first time, every chart is […]
Read More 
Blog
The New Referral Landscape: Strategies for Growth Amid Today’s Market Headwinds
Post-acute providers are navigating a market unlike any in recent memory. In our recent webinar, Trella Health’s Jess Chew (EVP of Growth), Natalie Deckbar (Director of Sales), and Josh Price (Senior Solution Engineer) unpacked what they’re hearing from providers across the country, and where the teams pulling ahead are finding growth. Four themes stood out. […]
Read More
Report
2026 Post-Acute Market Intelligence Report
Trella Health's 2026 Industry Trend Report is here — your trusted annual resource for timely insights and strategic guidance in the ever-evolving post-acute care landscape.
Read More 
Blog
The Discharge Bottleneck: Why More Data Isn’t Solving Care Transitions
Discharge planners today have access to more information than ever before. Referral platforms, EHR alerts, prior authorization tools, quality dashboards, payer requirements, provider directories, and portal-based workflows all promise to make post-acute care transitions easier. Yet care transitions remain one of the most fragile points in the patient journey. Delayed starts of care, missed referrals, […]
Read More 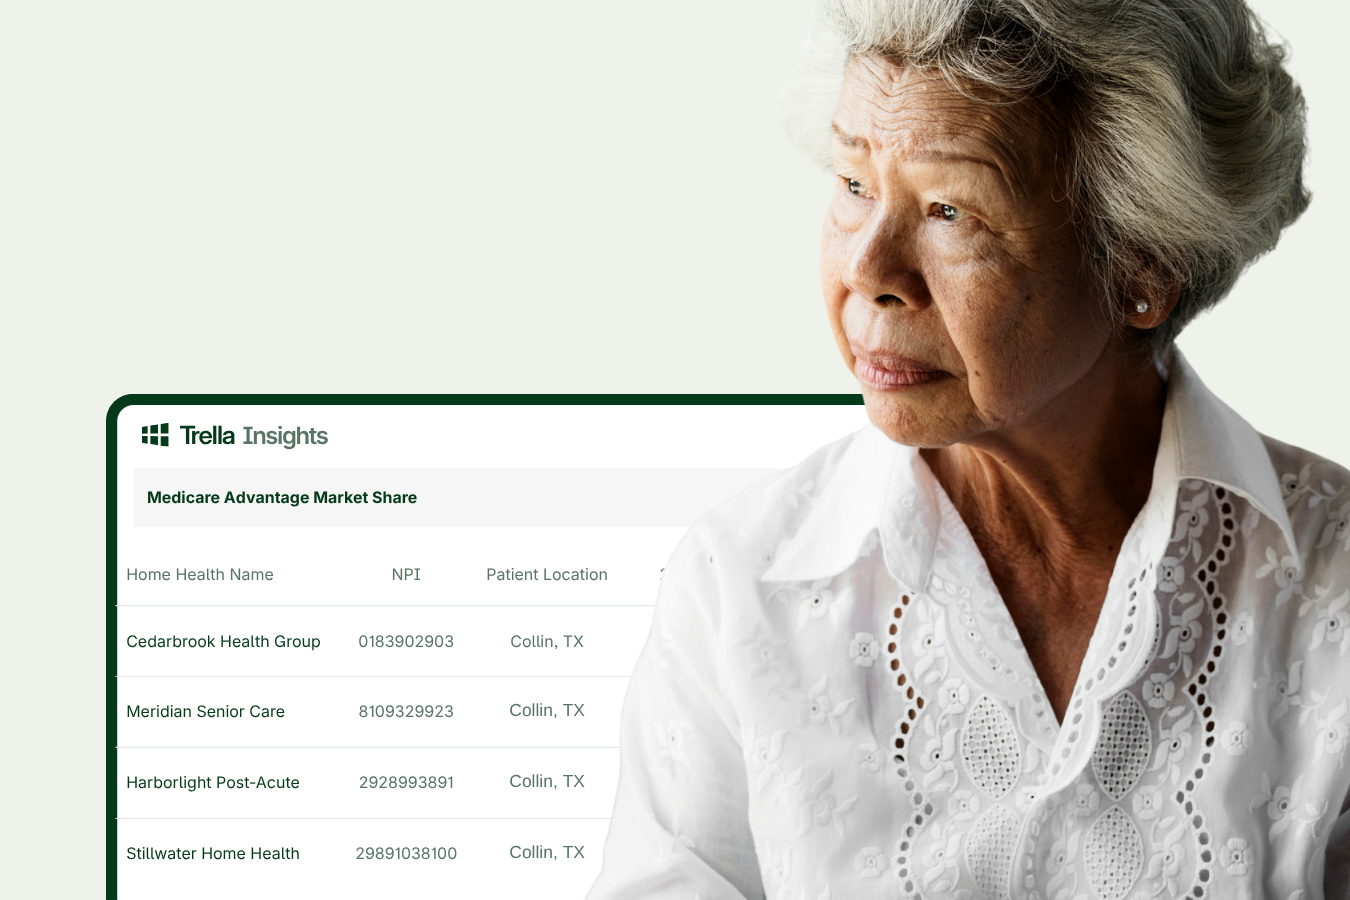
Blog
Medicare Advantage and the Site-of-Care Shift: What Providers Need to Know
The Medicare Advantage story is often framed around growth. But for post-acute providers, the more important story is how Medicare Advantage plans are actively influencing access, utilization, length of service, and provider selection after hospitalization. Through prior authorization, network design, benefit design, and other utilization controls, MA plans are increasingly influencing whether patients receive post-acute care, which providers participate in their care, and how much care is authorized. This shift […]
Read More 
Blog
Episode Accountability Is Here and Expanding
Value-based care is no longer a future-state concept. Episode accountability is already shaping how hospitals, physicians, and post-acute providers manage care beyond the initial encounter. Through mandatory episode-based models such as TEAM and the proposed CJR-X model, hospitals are increasingly accountable for the cost and quality of defined surgical episodes. Separately, population-based models such as […]
Read More 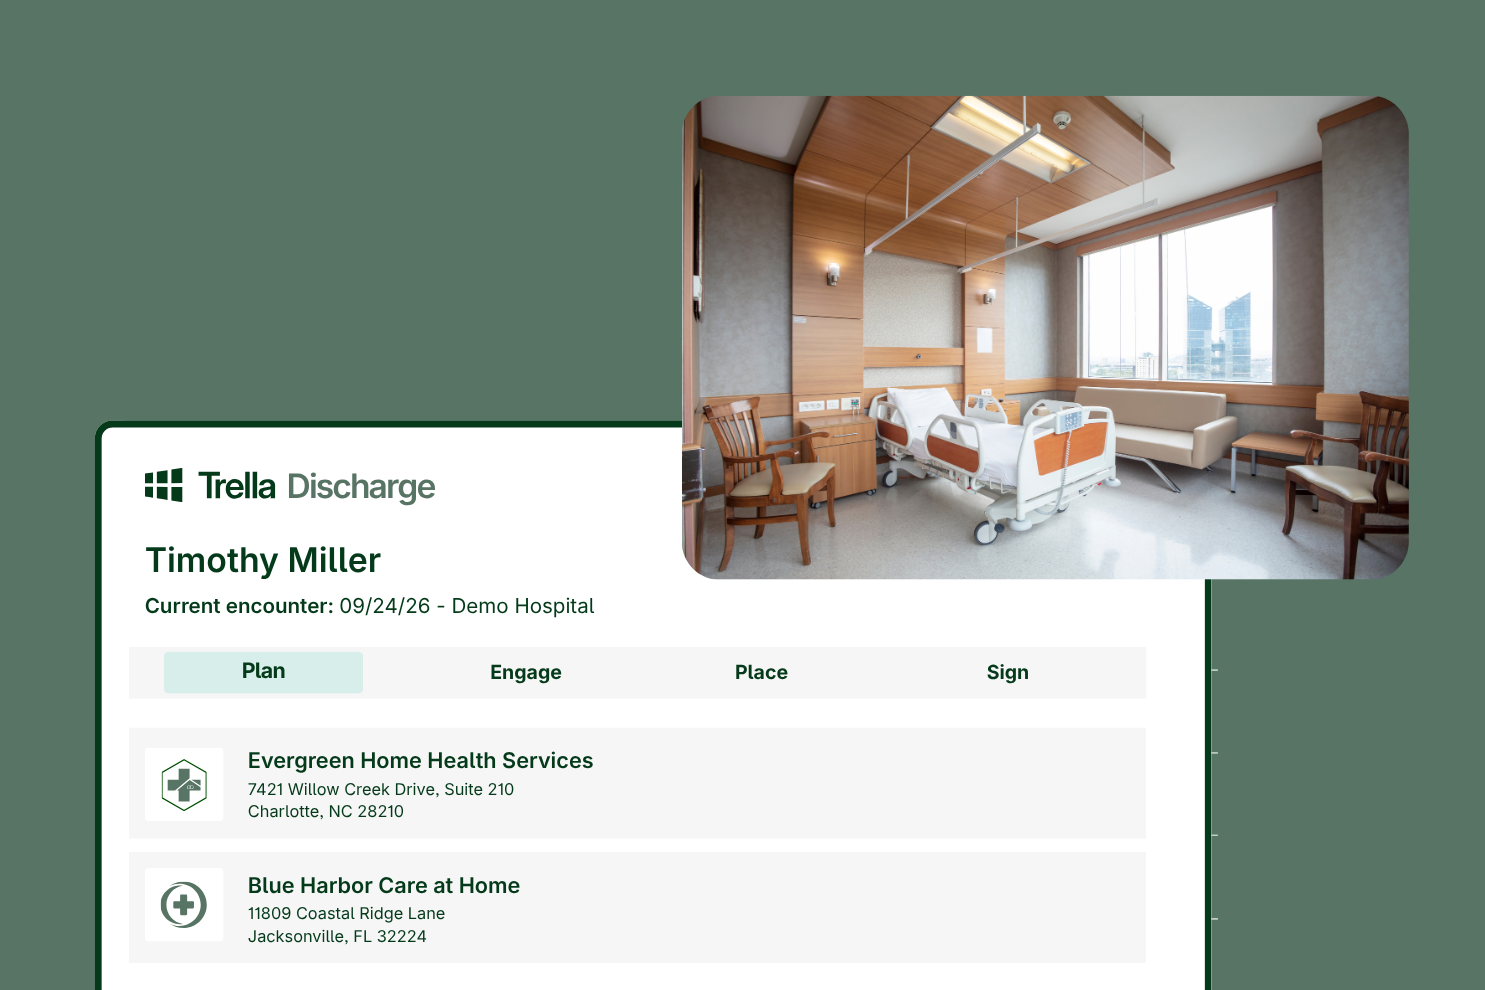
Blog
Eliminating Avoidable Delays in the Hospital – Turning Lost Time into Better…
Patients don’t want to spend a minute more—or less—in the hospital than necessary, and hospital leaders share that goal: quality care at the right time. Avoidable delays, whether in the emergency department, testing, discharge planning, or post-acute placement, affect patient safety, staff efficiency, throughput, and the overall care experience. Managing and eliminating these delays reduces […]
Read More 
Press Release
Trella Health Earns National and Regional Recognition as a Top Workplace in…
Employee feedback helped secure Trella Health’s inclusion on Modern Healthcare’s 2026 Best Places to Work in Healthcare list and Axios Atlanta’s 2026 Top Workplaces list. ATLANTA — July 08, 2026 — Trella Health today announced it has been recognized with two employee-driven workplace awards. The company was named to Modern Healthcare’s 2026 Best Places to Work in Healthcare list and Axios […]
Read More 
On Demand Webinar
The New Referral Landscape: Strategies for Growth Amid Today’s Market Headwinds
Today’s referral landscape looks very different than it did just a few years ago. Increased regulatory scrutiny, evolving value-based care models, hospital consolidation, and growing pressure to do more with fewer resources are reshaping how post-acute providers compete for referrals. The organizations succeeding in this environment aren’t just reacting to change—they’re adapting their strategies. They’re […]
Read More 
Report
The Drugs Driving Medicare Spending and Where Care Is Moving
Part B drug spending is on pace for roughly $58 billion in 2025, outrunning the Medicare program as a whole.
Read More