For years, hospice leaders have had to infer how CMS views their utilization patterns. That inference is no longer necessary. With the FY 2027 Hospice Wage Index final rule (CMS-1851-F), CMS released the Hospice Service and Spending Variation Index (SSVI) — a provider-level composite score, calculated for every Medicare-certified hospice with claims in the year examined, built from nine claims-based measures of utilization and non-hospice Medicare spending. The file covers FY 2024 and FY 2025, with the FY 2025 analysis spanning more than 6,600 hospices and nearly 157 million hospice days.
It is, in effect, a national benchmarking dataset organized around exactly the patterns drawing the most oversight attention.
CMS is explicit that a high SSVI score does not establish fraud or inappropriate care. But it is equally clear about intent: the index exists to flag potential outliers for targeted education and oversight and to support program integrity work. Once a score is public, it will be read by surveyors, referral partners, health systems building preferred networks, and anyone underwriting a transaction.
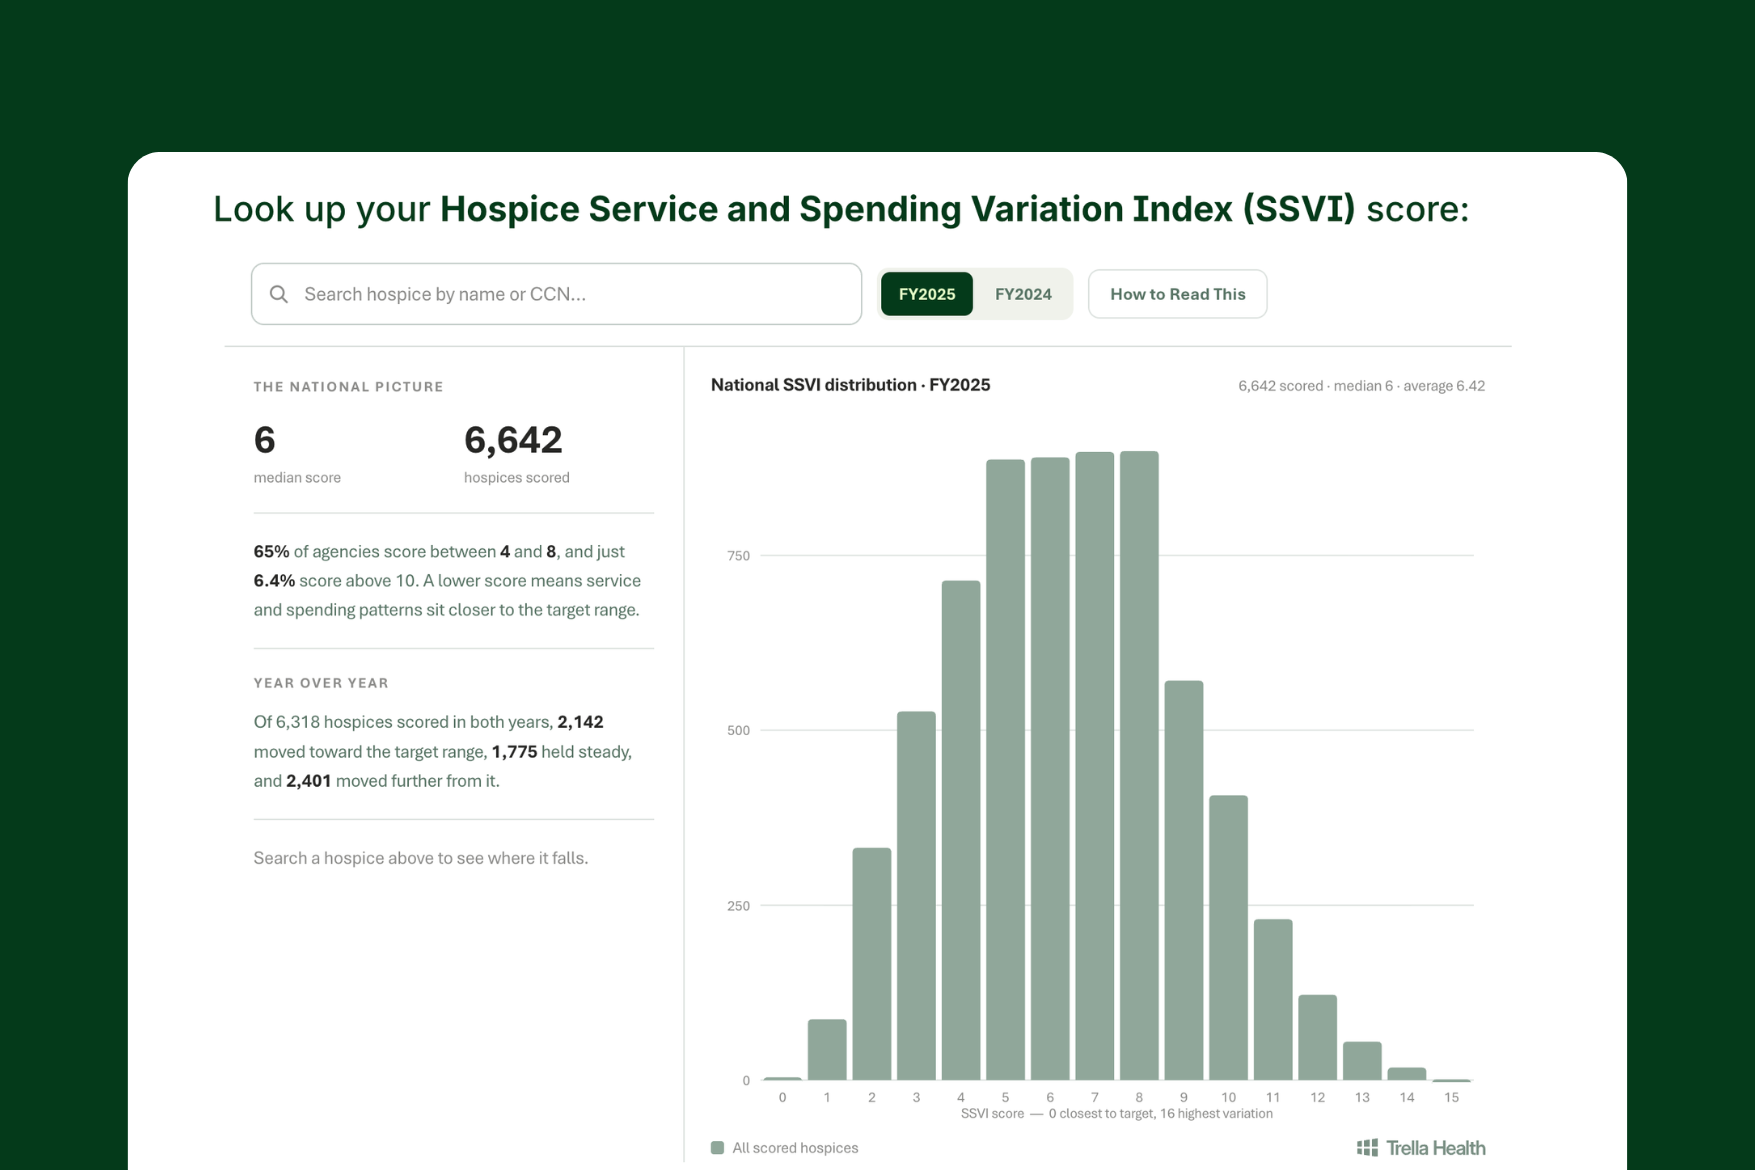
Look up your Hospice Service and Spending Variation Index (SSVI) score:
How the score is built
The SSVI runs from 0 to 16 and combines two halves.
The utilization score (0–8) assigns one point for each of eight patterns:
- Providing neither continuous home care nor general inpatient care during the year
- 40% or more of routine home care days delivered in a nursing home or SNF
- A skilled visit rate in the final two RHC days at or below the 25th percentile (≤87.5% in FY 2025)
- A live discharge rate at or above the 75th percentile (≥47.0.% in FY 2025)
- Discharges with a length of stay of 180+ days at or above the 75th percentile (≥33.3%)
- Average skilled nursing minutes per routine home care (RHC) day at or below the 25th percentile (≤9.9 minutes)
- Weekend RHC days with a skilled visit at or below the 25th percentile (≤4.8%)
- Live discharges returning within seven days at or above the 75th percentile (≥18.2%)
The non-hospice spending score (0–8) is the ninth measure. Hospices with no Medicare spending outside the hospice benefit score zero; everyone else falls into one of eight roughly equal-sized tiers based on spending volume.
Alongside the score, CMS publishes the underlying detail: ownership, the year the hospice began billing Medicare, facility type, urban or rural location, beneficiaries served, hospice days, average and median length of stay, long stays, live discharges, skilled visits, levels of care, and non-hospice spending.
Three things operators should understand about the methodology
Most flags are relative, not absolute. Six of the eight utilization criteria are percentile-based, meaning the thresholds depend on how a hospice performs relative to its peers. Your score can move even if your clinical practice does not. The FY 2024 and FY 2025 thresholds already differ — the seven-day return-to-the-same-hospicecut point moved from 15.0% to 18.2% in a single year. Managing a fixed internal target is not the same as managing a moving percentile.
Several flags can reflect operational patterns, not clinical judgment. Weekend skilled visit coverage, average nursing minutes per RHC day, and whether a hospice furnished any continuous home care (CHC) and general inpatient care (GIP) during the year. A small rural hospice with no GIP contract and thin weekend coverage can accumulate points without a single questionable certification. That is worth knowing before the score is interpreted as a quality signal.Two years of data means trajectory is visible. A score of 9 that came down from 12 tells a very different story than a score of 9 that rose from 5. CMS has given the industry a before-and-after, and direction of travel will matter more to sophisticated readers than the absolute number.
The market question the score does not answer
Here is the limitation. The SSVI is a provider-level score in a national distribution. It tells you where a hospice sits relative to all hospices — not relative to the hospices it actually competes with for referrals.
That distinction matters enormously in practice. A score of 8 may look very different in a market where competitors cluster at 9 than one where they cluster at 4 and could raise different questions for referral partners or network teams. Nursing-facility concentration, length of stay, and live discharge patterns can be influenced by local referral mix and local competitor behavior. Reading a score without reading its market is reading half the story.The more useful questions are comparative:
- How does your score compare to the hospices you share referral sources with? Not the national median — the five providers your top SNFs and health systems also discharge to.
- Which specific measures are driving scores up in your market? If everyone in the market is flagging nursing-facility concentration, that is a market structure story. If only you are, it is an operational one.
- Does the score correlate with referral volume locally? Whether high-scoring providers are gaining or losing share is the clearest early signal of how referral sources are responding.
- Where did competitors move between FY 2024 and FY 2025? Movement can identify organizations worth examining more closely and help distinguish stablituy from changing utilization patterns. Do the patterns behind your score track your referral-source mix? Long stays and nursing-facility concentration often follow from where patients come from, and that is a defensible narrative if you can document it.
What to do in the next quarter
Pull your own score and decompose it measure by measure. A 10 built from spending tiers is a different problem than a 10 built from visit-intensity flags, and they call for different responses.
Then build the market view. Layer your score and your competitors’ onto referral volume and referral-source data, and you can see not just where you stand, but whether standing there is costing you volume.
Finally, prepare the narrative before someone else writes it. Referral partners and network teams may start asking about these numbers, and hospices that can explain their score in the context of their patient population and their market will be far better positioned than those meeting the question for the first time in a partnership review.
CMS built the SSVI to spot outliers. For hospice operators, Trella believes it can also become a useful market map — a public, provider-level view of how hospice care is actually delivered, market by market.
Trella Health pairs CMS utilization data with referral, volume, and market-share intelligence so you can see your score in the only context that matters: your market. Request a demo to see how your organization and your competitors compare.