Use these condensed trend reports and insights to quickly see the state of the post-acute industry. Feel free to to share this page, check back for quarterly updates, and use the charts in your own presentations.

Up to Date. To the Point. Always Insightful.
Post-Acute Industry Trends Quarterly
Latest data available as of July 2026
Your source for post-acute industry trends
National Fee-For-Service Admissions | 2025 Q4*
Home Health
Year-over-year home health FFS admissions increased from 723.2K to 731.6K (+1.16%) between 2024 Q3 and 2025 Q3.
Hospice
Year-over-year hospice FFS admissions increased from 401.0K to 413.9K (+3.22%) between 2024 Q4 and 2025 Q4.
Skilled Nursing
Year-over-year skilled nursing FFS admissions increased by 0.55%, from 383.5K in 2024 Q4 to 385.6K in 2025 Q4.

Fee-For-Service Inpatient Discharge Instructions | 2025 Q4
Home Health
The percentage of inpatient stays instructed to seek home health services remained unchanged between the rolling four quarters ending in 2025 Q4 (22.6%) and the rolling four quarters ending in 2024 Q4 (22.6%).
Hospice
The percentage of inpatient stays instructed to seek hospice services slightly increased between the rolling four quarters ending in 2025 Q4 (4.1%) and the rolling four quarters ending in 2024 Q4 (4.0%).
Skilled Nursing
The percentage of inpatient stays instructed to seek skilled nursing care decreased slightly between the rolling four quarters ending in 2025 Q4 (20.0%) and the rolling four quarters ending in 2024 Q4 (20.3%).

National Medicare-Eligible Enrollment**
Medicare Advantage enrollment continues to grow. Medicare beneficiaries enrolled in a Medicare Advantage plan represented 55.4% of beneficiaries enrolled in both Medicare Parts A and B in 2025, an increase from 54.7% in 2024 and an increase of nearly 19 percentage points from 36.7% in 2017.

*Note about FFS admissions data:
FFS home health, hospice, and skilled nursing admissions are based on claims initially released by CMS to their virtual research data center and accessible by Trella Health. As such, the true number of admissions could be higher when claims that were filed after the initial release are factored in. Trella Health uses the initially released data for earlier quarters to provide a more accurate directional trend analysis for the latest available data.
**Note about Medicare Advantage enrollment data:
As of December 2023, we’ve refined our Medicare Advantage enrollment data sources from using the “Original Medicare Beneficiaries” and “Medicare Advantage and Other Health Plan Beneficiaries” to using the “Original Medicare Part A and Part B Beneficiaries” and “Medicare Advantage and Other Health Plan Part A and Part B Beneficiaries”. This adjustment aligns the Medicare Advantage and Traditional Medicare enrollment definitions to be more similar.
Post-Acute Care Industry Trend Report
Post-Acute Care Industry Trend Report
As part of our mission to promote industry-wide performance visibility, we are excited to share the findings of this year’s Post-Acute Care Industry Trend Report.
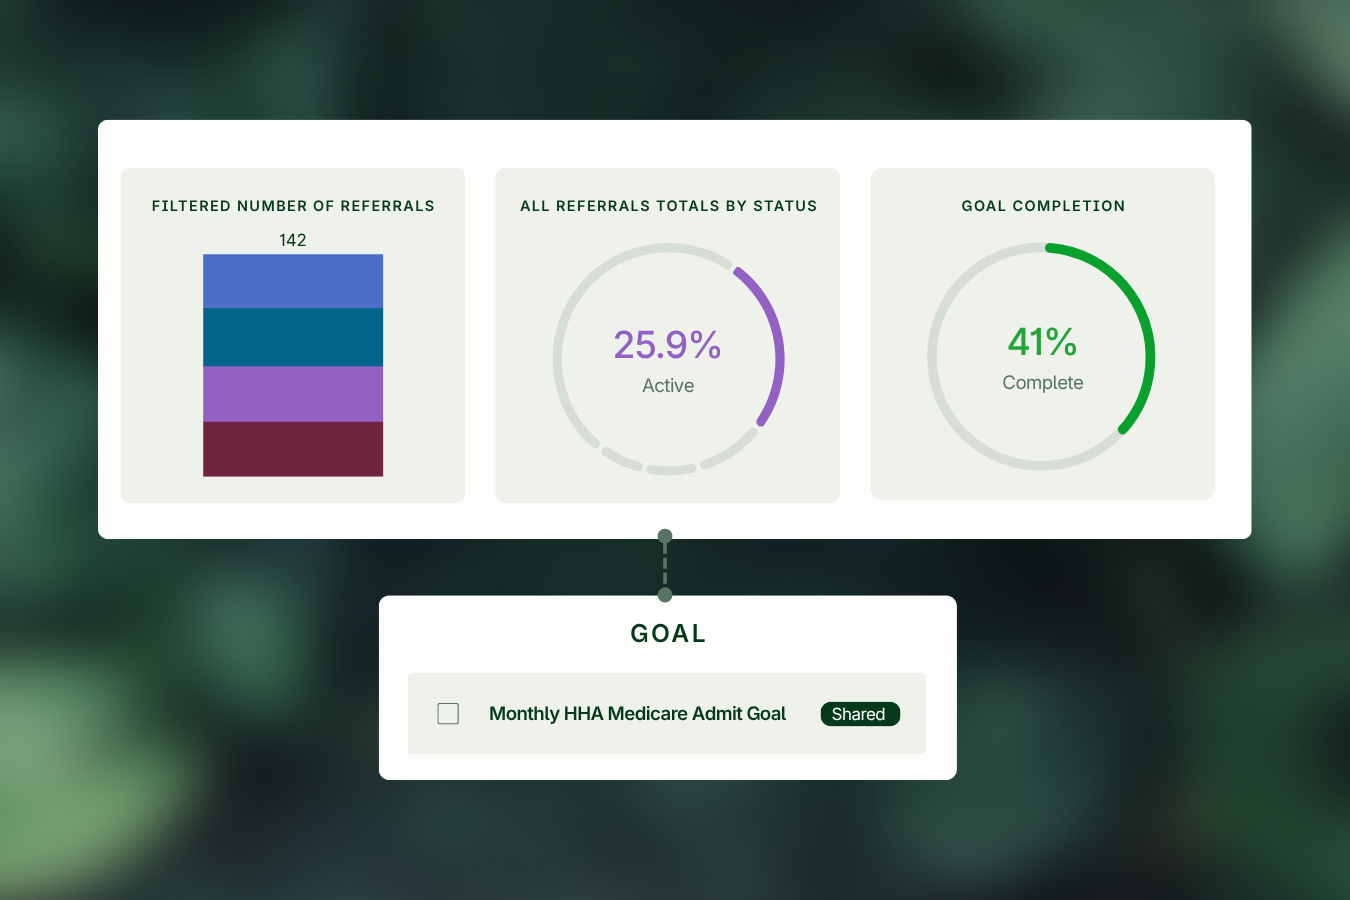
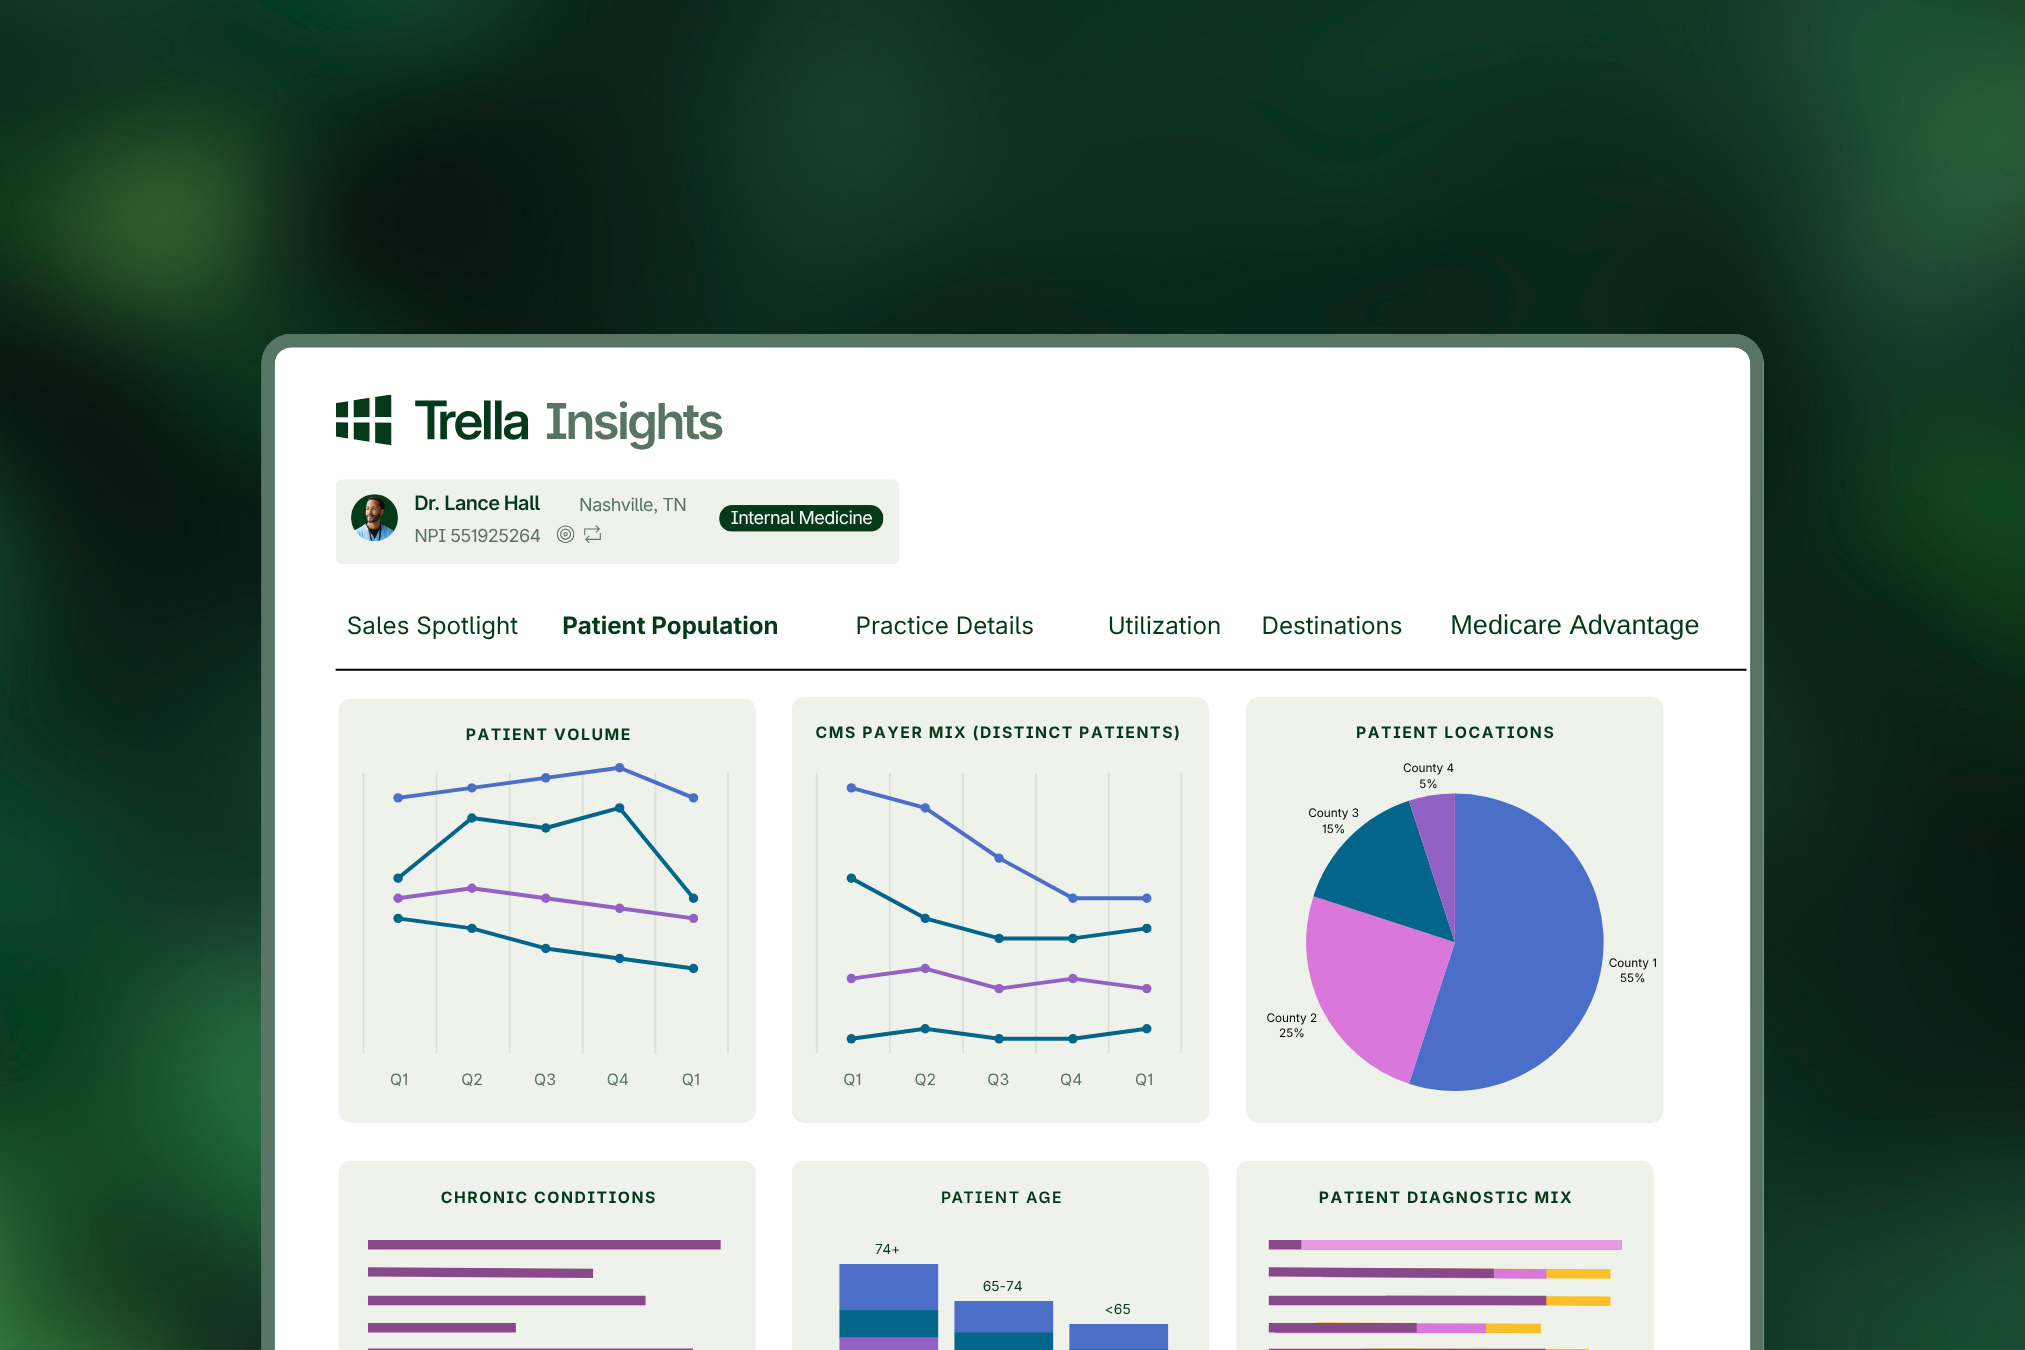
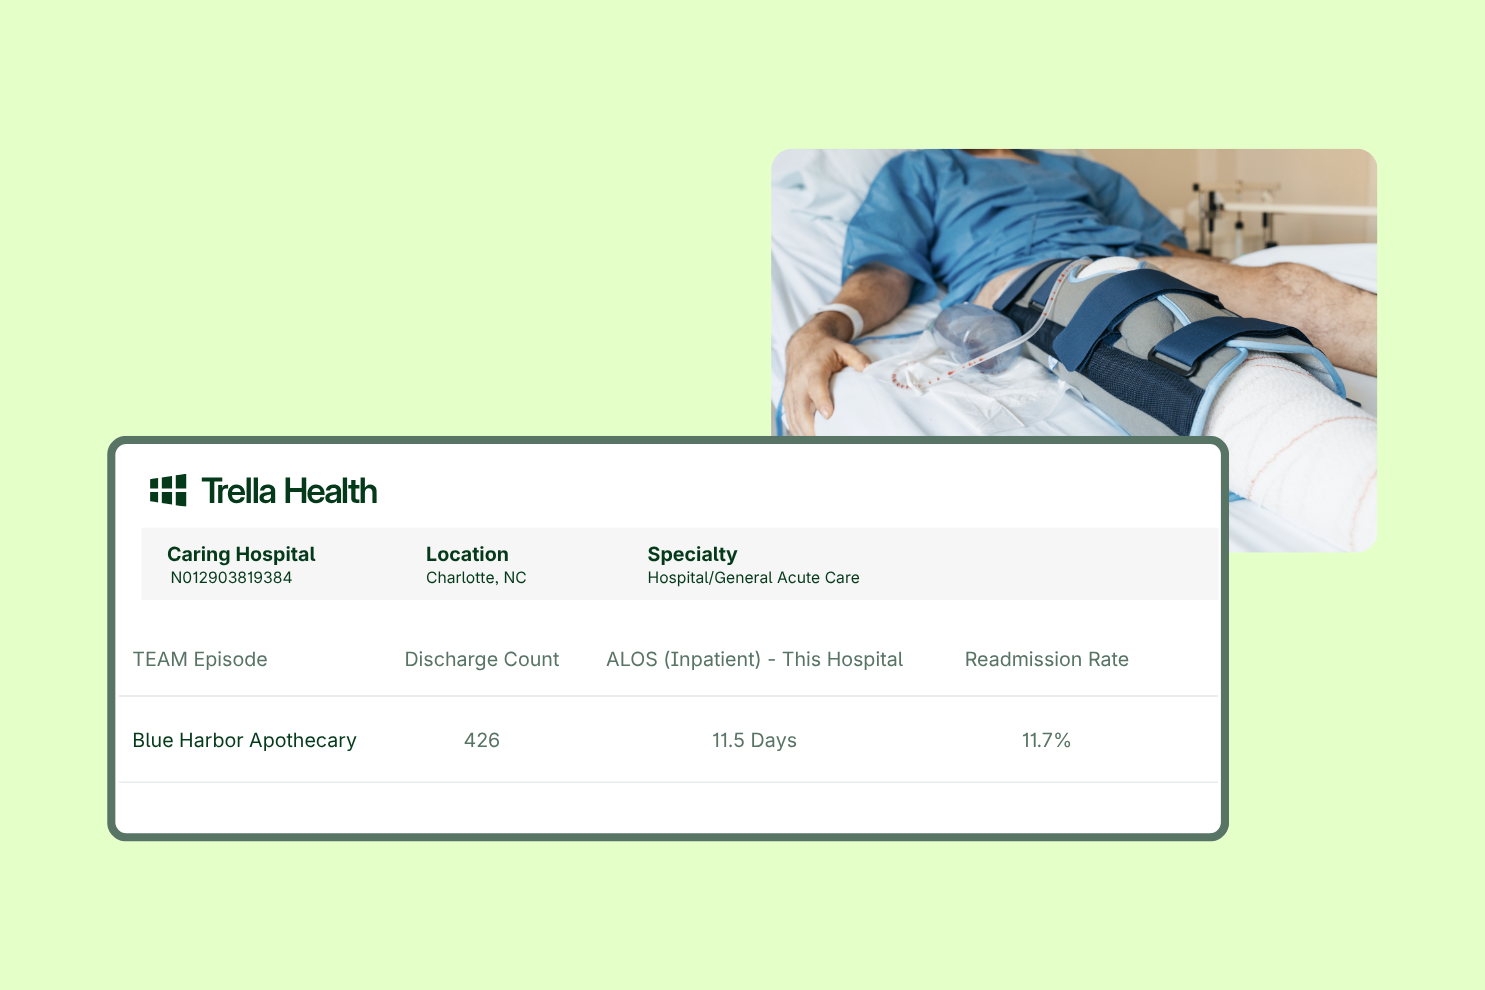
Trella Impact
Real impact across the care continuum.
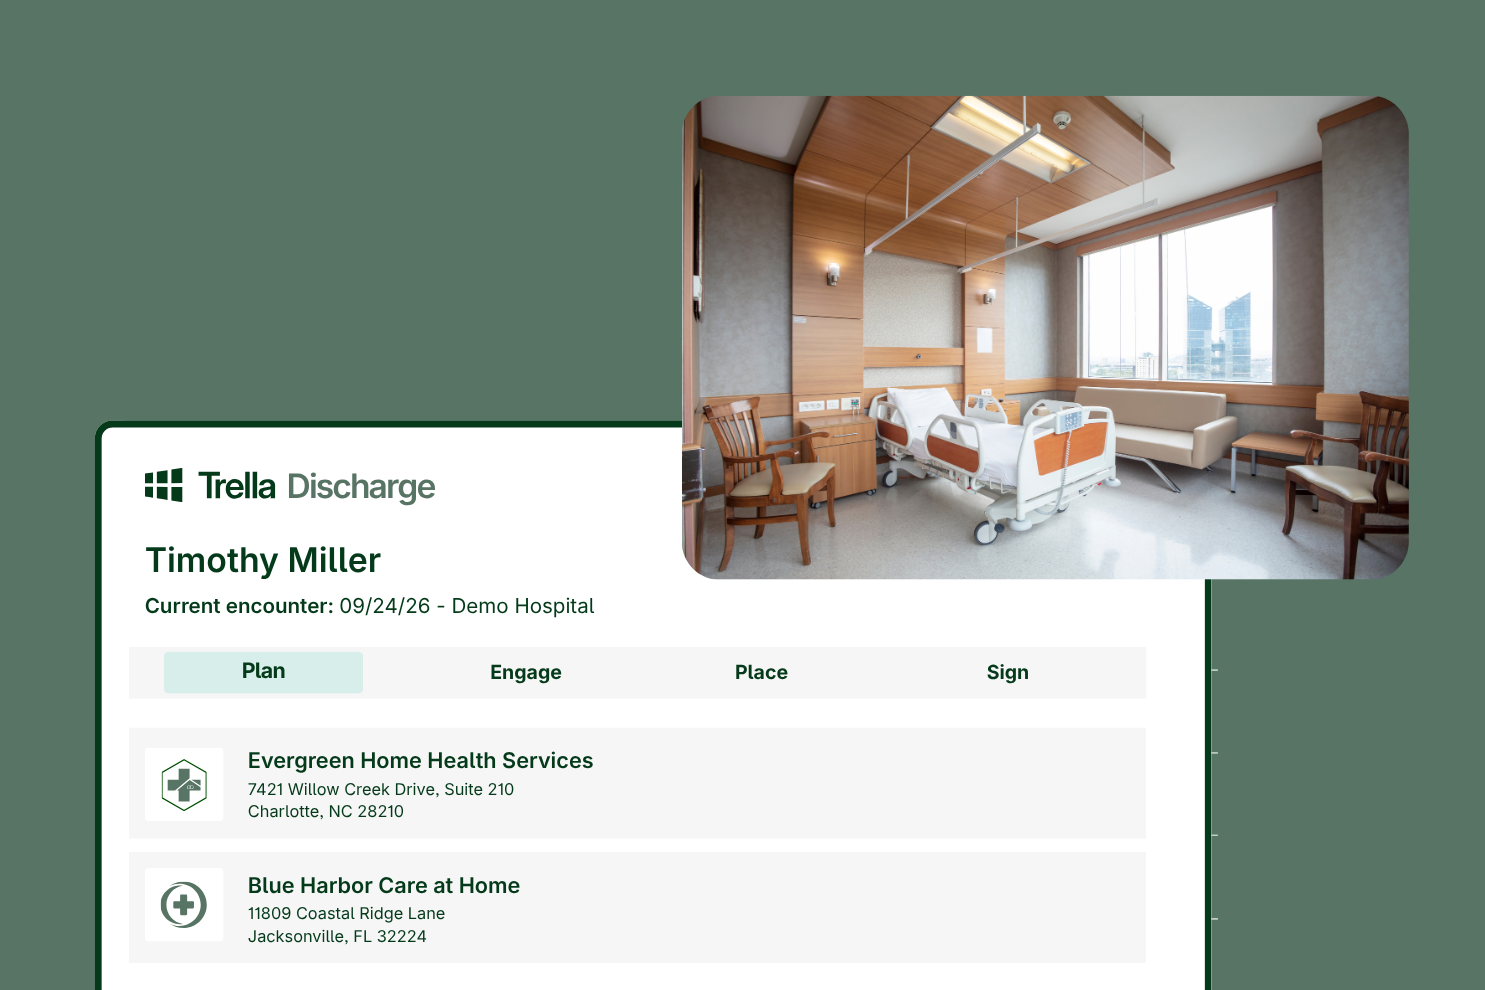
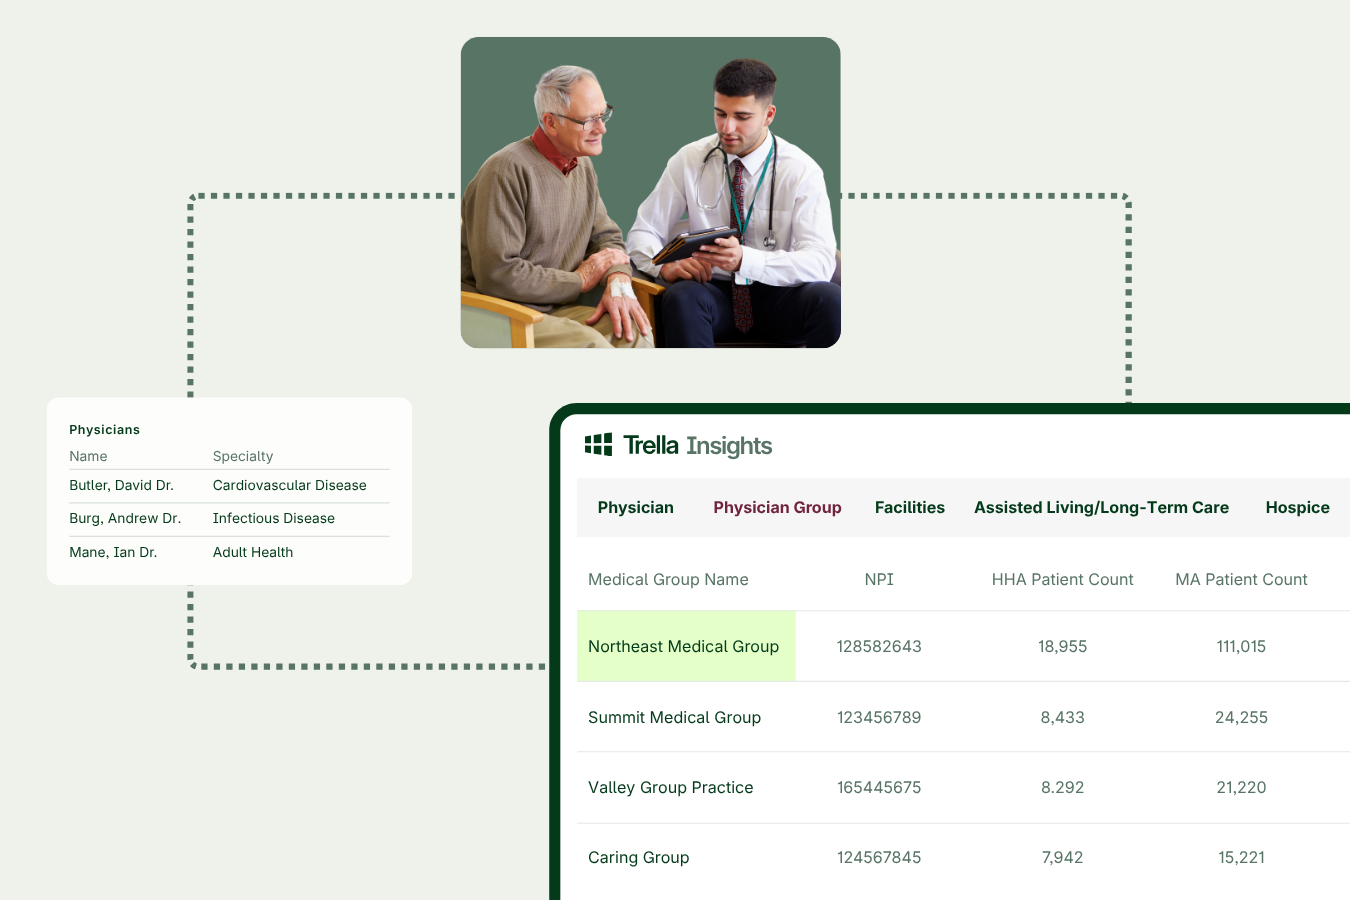
From market strategy to referral growth to discharge coordination, Trella helps teams make smarter decisions that strengthen business performance, improve care transitions, and support healthier outcomes.
100%
Part A and B claims from CMS
10 K+
users across 700+ customers
1 M
Medicare lives are represented
90%
of U.S. lives aged 65+ covered.
2.9 Billion
claims analyzed annually
Resources
Insights, trends, and strategies for leaders across the care continuum.