
Post-acute care is where a well-run inpatient episode either holds together or quietly comes apart. In our recent webinar introducing Trella Network Insights, Stephanie Orosz (Solution Engineer), Meredith Posivak (Senior Director of Product), and Deborah Karn Calvy (Senior Advisor, Clinical Strategy) walked health system leaders through why post-acute network performance belongs on the executive agenda — and demonstrated the three tools now available to act on it.
Here’s the recap, along with the moments from the session worth carrying into your next network conversation.
Trella Network Insights
See where your patients go after discharge and what it costs you
Model your post-acute network, benchmark every destination nationally, and expose episode economics. Fewer readmissions. Stronger partners. Lower episode costs.
Request a DemoPost-acute performance is a system-level lever, not a downstream detail
Deb opened by reframing the conversation. Care transitions aren’t an operational afterthought — they move the metrics leadership is already accountable for.
“Efficient care transitions and post-acute care performance are not downstream operational details. They are system-level levers. They directly influence readmissions, inpatient throughput, patient experience, and total cost, and are a must for value-based care arrangements.” — Deborah Karn Calvy
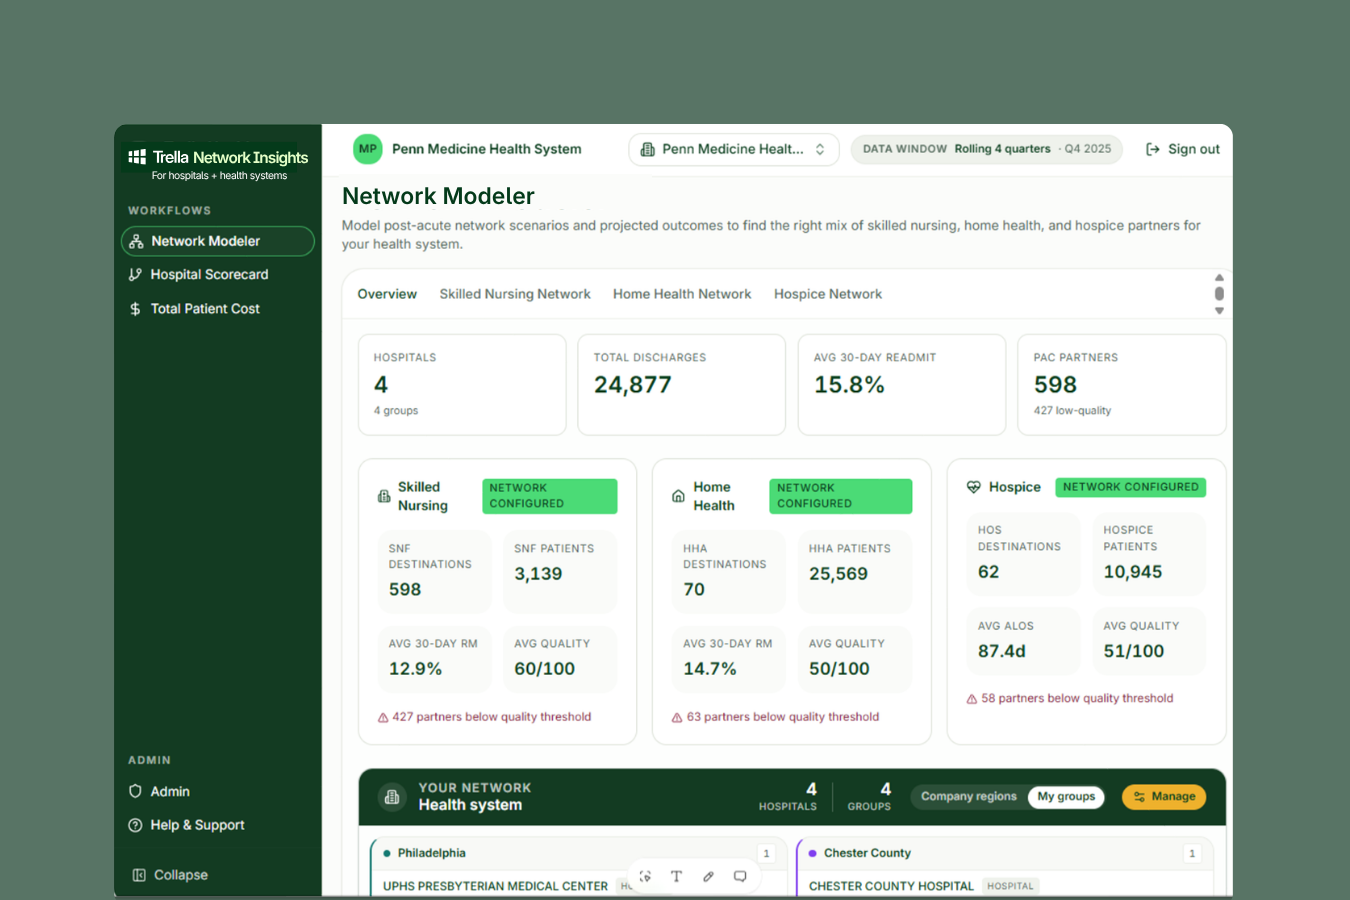
How Trella solves for this: Network Insights brings three views into one workflow — Network Modeler to evaluate partner configurations, Hospital Scorecard to benchmark performance, and Total Patient Cost to expose episode economics — so post-acute performance is measured with the same rigor as any other system-level lever.
She grounded it in three numbers: $52.4 billion in annual cost to the U.S. health care system from 30-day readmissions; 2x — the rate at which length of stay before post-acute discharge grew for Medicare Advantage patients between 2019 and 2024 compared to traditional Medicare; and 8.9, the average number of inpatient days before a patient is discharged to post-acute care.
That MA trend line matters more every year. As Deb put it: “If your payer mix is shifting towards MA, the way most systems are, that trend line matters to you directly.”
A formal network moves readmissions — but only if partners are held to it
Health Affairs research on formal SNF networks shows patients discharged to a hospital’s high-performing SNF network see a 4.5 percentage point greater relative reduction in readmissions than patients discharged to non-network facilities. Deb credited three mechanisms: warm standardized handoffs, early deterioration detection, and accountable partners.
“Preferred facilities that are actually measured on readmissions and held to that standard — not just included on a list.” — Deborah Karn Calvy
How Trella solves for this: The Trella Score turns a preferred list into a measured one. Network Insights builds a composite quality score across readmission rates at 30, 60, and 90 days, hospital-specific rehospitalization rates, inpatient length of stay, and patient risk score — and you can adjust the weighting of every metric to match how your system defines performance.
Length of stay has three drivers, and fixing one won’t do it
Deb walked through discharge readiness (partners staffed to accept patients the day they’re ready), appropriateness (matching complex patients to facilities with the right clinical capabilities the first time), and preference (a partner mix broad enough that patient choice stops becoming a delay). Research shows periods of lower nurse staffing across network SNFs are associated with roughly 3.5% longer hospital length of stay — about six additional hours of excess inpatient time per episode.
“I want to be clear that these three are interconnected. Fixing only one of them will not solve your length of stay problem.” — Deborah Karn Calvy
How Trella solves for this: Rather than optimizing one variable in isolation, the Network Modeler projects the combined effect of network changes on inpatient average length of stay, hospital-specific 30-day readmission rate, and overall network quality at the same time — so you can see the tradeoffs before you make them.
Scenario 1: You built a preferred network. Where are the other patients going?
The first live demo tackled a problem nearly every attendee recognized: a preferred SNF and home health network exists, but there’s no visibility into the patients who land outside it.
“It gives you visibility into where all of my patients are going today, even if they’re outside of network, and then being able to really model those changes before you make any changes on the execution side.” — Meredith Posivak
How Trella solves for this: The Network Modeler shows every post-acute destination receiving your discharges — in-network or not — with total patient count, affiliation percentage, and quality metrics for each. You then model volume shifts and watch projected readmission rates and length of stay respond, and save, load, and share those models across your organization. It’s built for SNF, home health, and hospice, at a single hospital, a regional group, or the full system.
Scenario 2: Getting ready for TEAM and global budget exposure
For systems entering CMS’s mandatory TEAM bundle — or operating under an AHEAD-style global budget — the question is which episode categories carry the most financial exposure from post-acute performance.
“This means regardless of where that patient is receiving their care post-discharge, what was the cost, and how was that impacted within each of the TEAM episode categories?” — Meredith Posivak
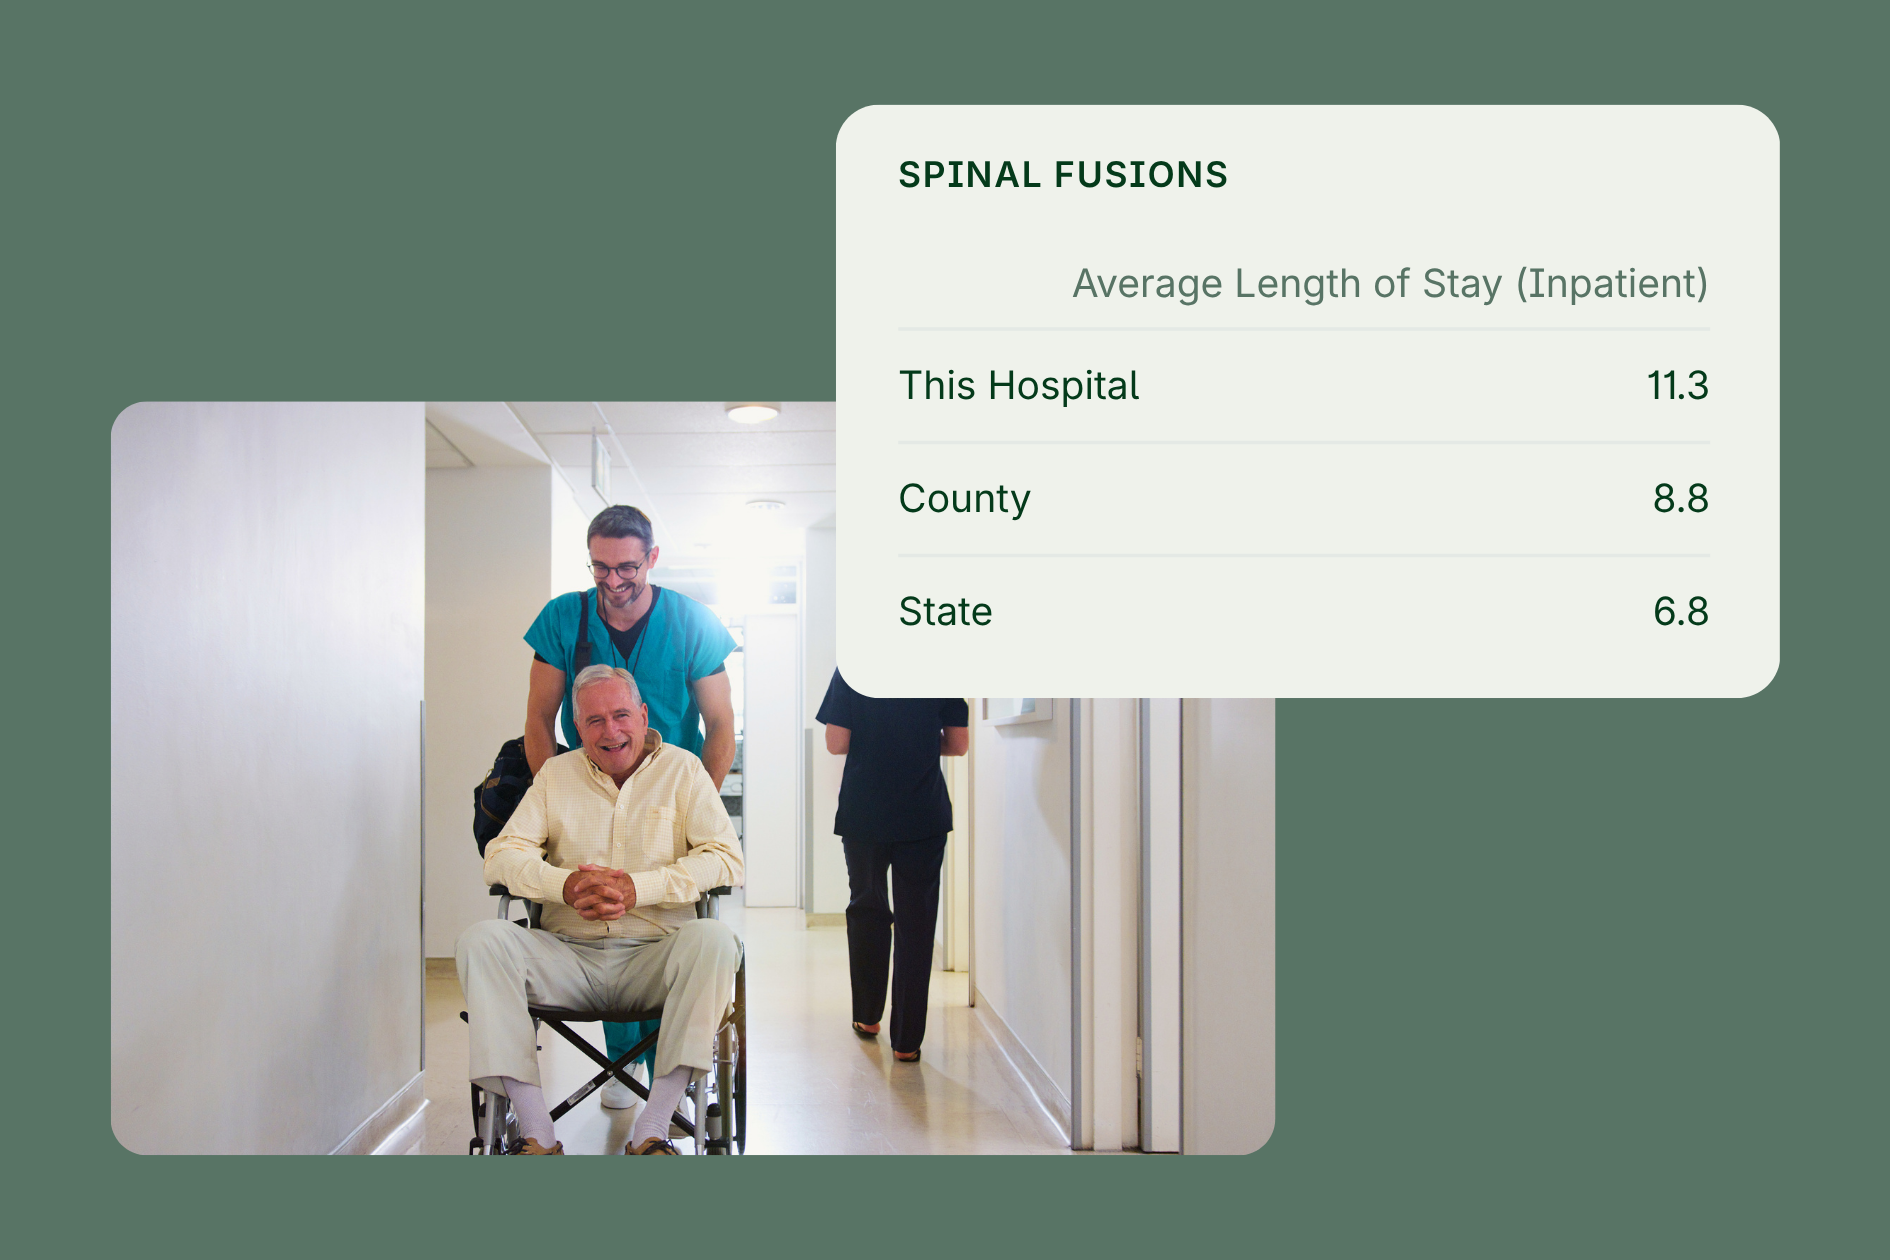
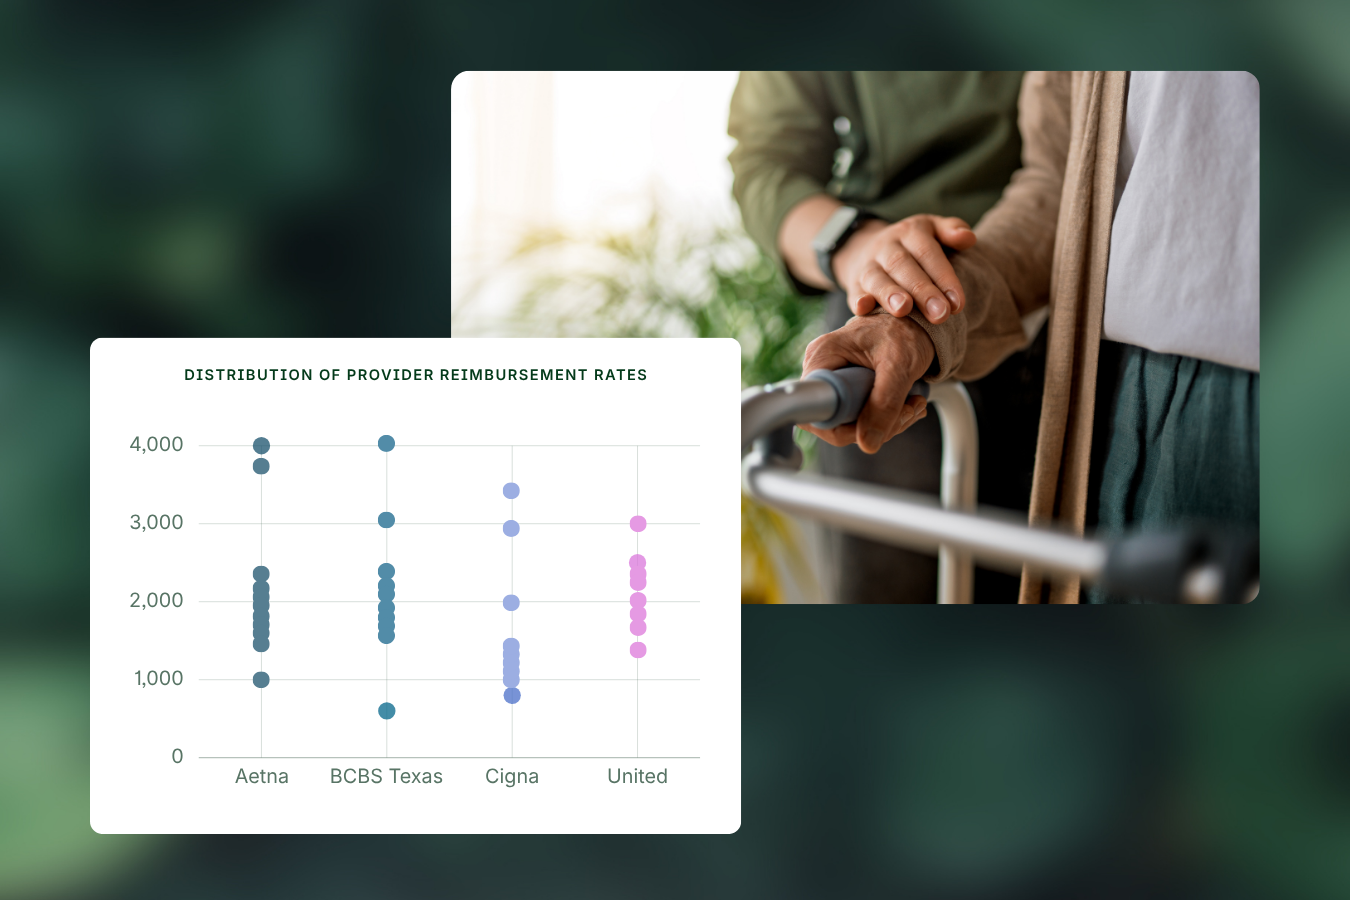
How Trella solves for this: The Hospital Scorecard covers any hospital nationally with Medicare fee-for-service data, broken out by all five TEAM episode categories with patient volume, average inpatient length of stay, readmission rate, and average total spend per patient plus 30 days post-discharge — against county, state, and peer-hospital benchmarks. You can drill into diagnostic groups and MS-DRGs to find the destinations dragging performance, and an AI-powered Trella Takeaway surfaces the outliers in a click instead of a table crawl.
Scenario 3: Two hospitals, same readmission rate, different cost
“You’ve got two hospitals with nearly identical 30-day readmission rates, and you would think the post-acute utilization would be similar and post-acute performance would be similar — but it’s not. And no one can say why.” — Stephanie Orosz
How Trella solves for this: Total Patient Cost compares episode-level spend across every claim setting for three or six months post-discharge, filtered by acuity, age, BPCI groups, readmission penalty groups, and diagnostic groups. In the demo, filtering to sepsis surfaced an even bigger difference between hospitals than the all-patient view showed — the kind of driver that stays invisible until you cut the data by cohort.
Quality scores aren’t the whole story
An attendee asked how to balance SNFs with strong quality scores against partners who take high-acuity or Medicaid patients.
“We just understand that it’s not black and white with quality metrics. You have the ability to add the contextualization for those relationships.” — Meredith Posivak
How Trella solves for this: Two ways. The Trella Score reverse-weights patient risk, so facilities taking higher-acuity patients aren’t penalized for it. And a custom engagement score — added specifically because early feedback asked for it — lets you score partners on whatever matters to you (Medicaid access, response rate, true partnership) and weight it as heavily as any clinical measure.
A network only counts if patients actually go there
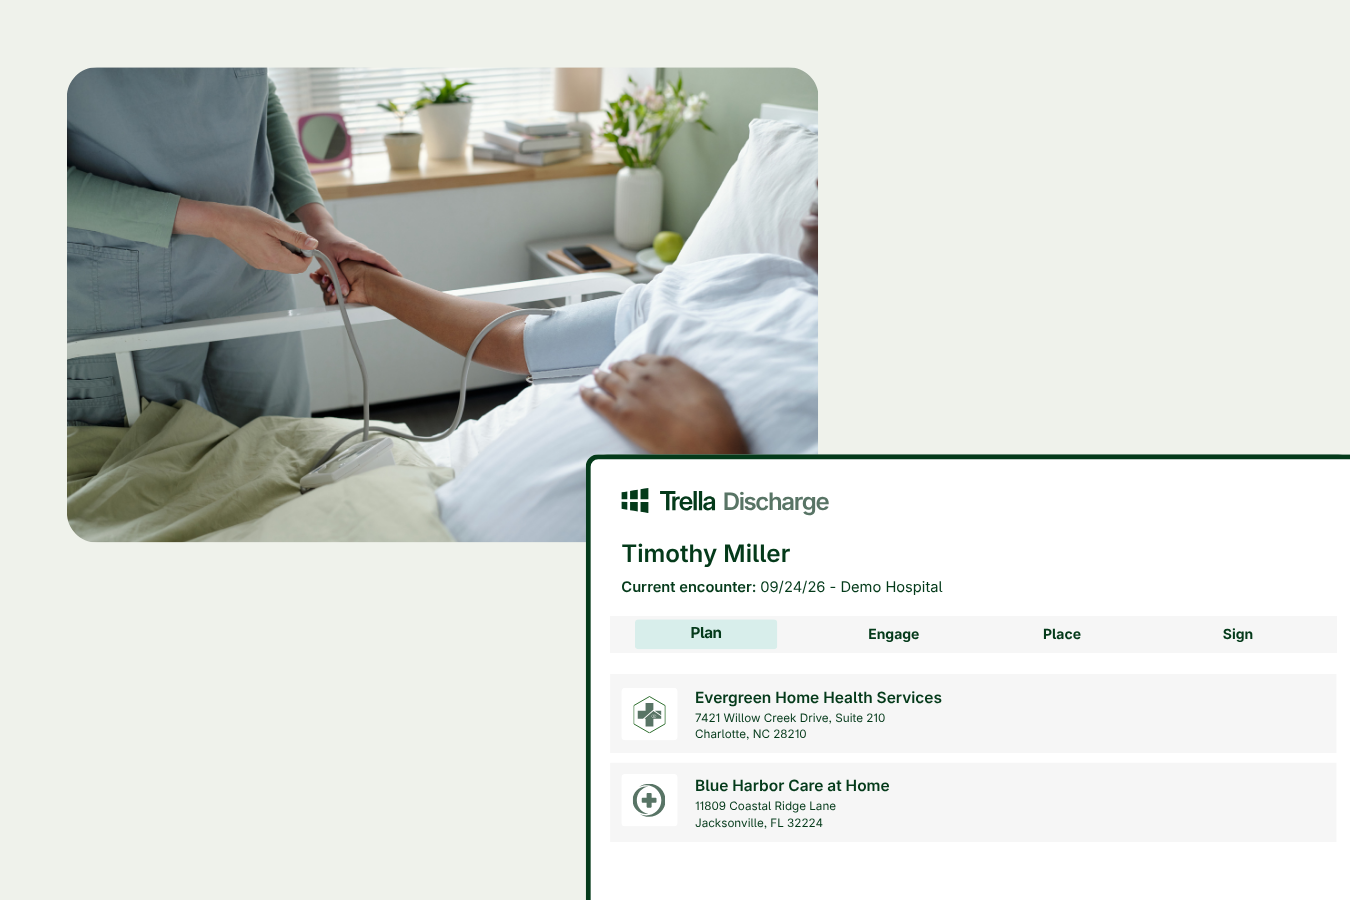
Stephanie closed the demo portion with the operational reality: “You may build out that network, but if your patients aren’t actually going there, there’s no point in having it.” Trella’s discharge automation tool — currently Repisodic, transitioning to Trella Discharge — flags preferred and tiered partners inside the care manager’s workflow, and has driven about a 36% increase in referrals and ultimate patient placements into preferred networks across customers.
Implementation is fast: fully implemented within about a week, with Trella loading your hospital and post-acute NPIs and a help center built into the product.
Five things to take away
- Efficient care management is a financial strategy. The performance gap between top and median systems under value-based care isn’t clinical — it’s operational and intentional.
- Data enables proactive intervention. Risk stratification, early identification, and predictive analytics are the foundation of every high-performing care transition program, not nice-to-haves.
- Workflow drives performance. Standardized, scalable discharge pathways eliminate the process variation that creates avoidable cost.
- Post-acute selection determines outcomes. Partner quality, episode-specific alignment, and closed-loop communication separate a well-executed discharge from a $15,000-or-more readmission.
- Technology connects it all. Purpose-built platforms combining data visibility, workflow automation, and network intelligence are how high-performing organizations scale.
Ready to see where your patients are actually going? Reach out to learn how Trella Network Insights can help you build, measure, and operationalize a high-performing post-acute network.
Trella Network Insights
See where your patients go after discharge and what it costs you
Model your post-acute network, benchmark every destination nationally, and expose episode economics. Fewer readmissions. Stronger partners. Lower episode costs.
Request a Demo